
ClearGlass Analytics is an independent data analytics company that enables asset owners, investment advisors, and asset managers to evaluate the Value for Money (VfM) of their investments through transparent cost and performance data.
As part of the product team, I contributed to the development of a SaaS platform designed to serve all sides of the asset management market, delivering structured cost transparency and advanced analytics across the UK and European investment ecosystem. The platform integrates industry frameworks such as the Cost Transparency Initiative (CTI) and the Cost Transparency Standard (CTS), enabling consistent data collection, benchmarking, and more informed investment decision-making.
Designing for this product presented unique challenges due to the highly cyclical nature of the industry. The platform operates around critical annual reporting cycles that determine when new features, improvements, and data submissions can be tested and adopted by users. These overlapping cycles created a distinctive product development rhythm and required careful prioritisation to ensure the platform evolved without missing key market opportunities. As one of the first platforms of its kind, the product played a pioneering role in bringing transparency and benchmarking capabilities to the asset management industry.
The organisation operated with a strong product-led mindset, with well-informed stakeholders actively collaborating across teams. Continuous experimentation, research, and rapid shifts in focus were embedded in the company culture, creating a fast-paced environment where multiple teams ran parallel initiatives to validate ideas and improve the product.
Conducting UX research in this domain presented additional complexity. Many users interacted with the platform only periodically during reporting cycles rather than daily, which made recruitment and engagement more difficult. To overcome this, we conducted regular user interviews (approximately every two weeks) and supplemented qualitative insights with internal data analysis and feedback from customer-facing teams. Asset owners were generally more open to participation than asset managers, which influenced our research strategy.
We triangulated insights from multiple sources to inform design decisions, combining user feedback with behavioural data from analytics tools such as Google Analytics, Hotjar, and Mixpanel. These insights were shared across the organisation on an ongoing basis, ensuring that product development remained aligned with real user needs and market dynamics.
Asset Manager Data Submission Journey
Designing a scalable ingestion and validation workflow for complex financial data.
Overview
ClearGlass’ platform relies on collecting detailed cost and performance data from asset managers, which is then processed and delivered to asset owners for benchmarking and reporting. Asset managers were responsible for uploading multiple datasets in different formats, often across several files. Because this data feeds directly into the platform’s analytics and reporting capabilities, the quality and structure of submissions had a direct impact on downstream processes. The project focused on redesigning the asset manager submission journey to improve data quality, reduce operational friction, and accelerate the delivery of investment insights to clients.
My Role
Responsibilities included:
Leading product discovery workshops alongside the product manager assigned to the project
Mapping complex multi-step user journeys
Designing submission workflows and complex validation mechanisms
Creating wireframes, prototypes, and high-fidelity designs within the product gudeline
Running iterative testing and analysing behaviour through analytics tools (HotJar & MixPanel)
Collaborating closely with product managers, engineers, and customer success teams
Supporting continuous iteration across multiple product cycles
The Problem
The original data submission process presented several challenges:
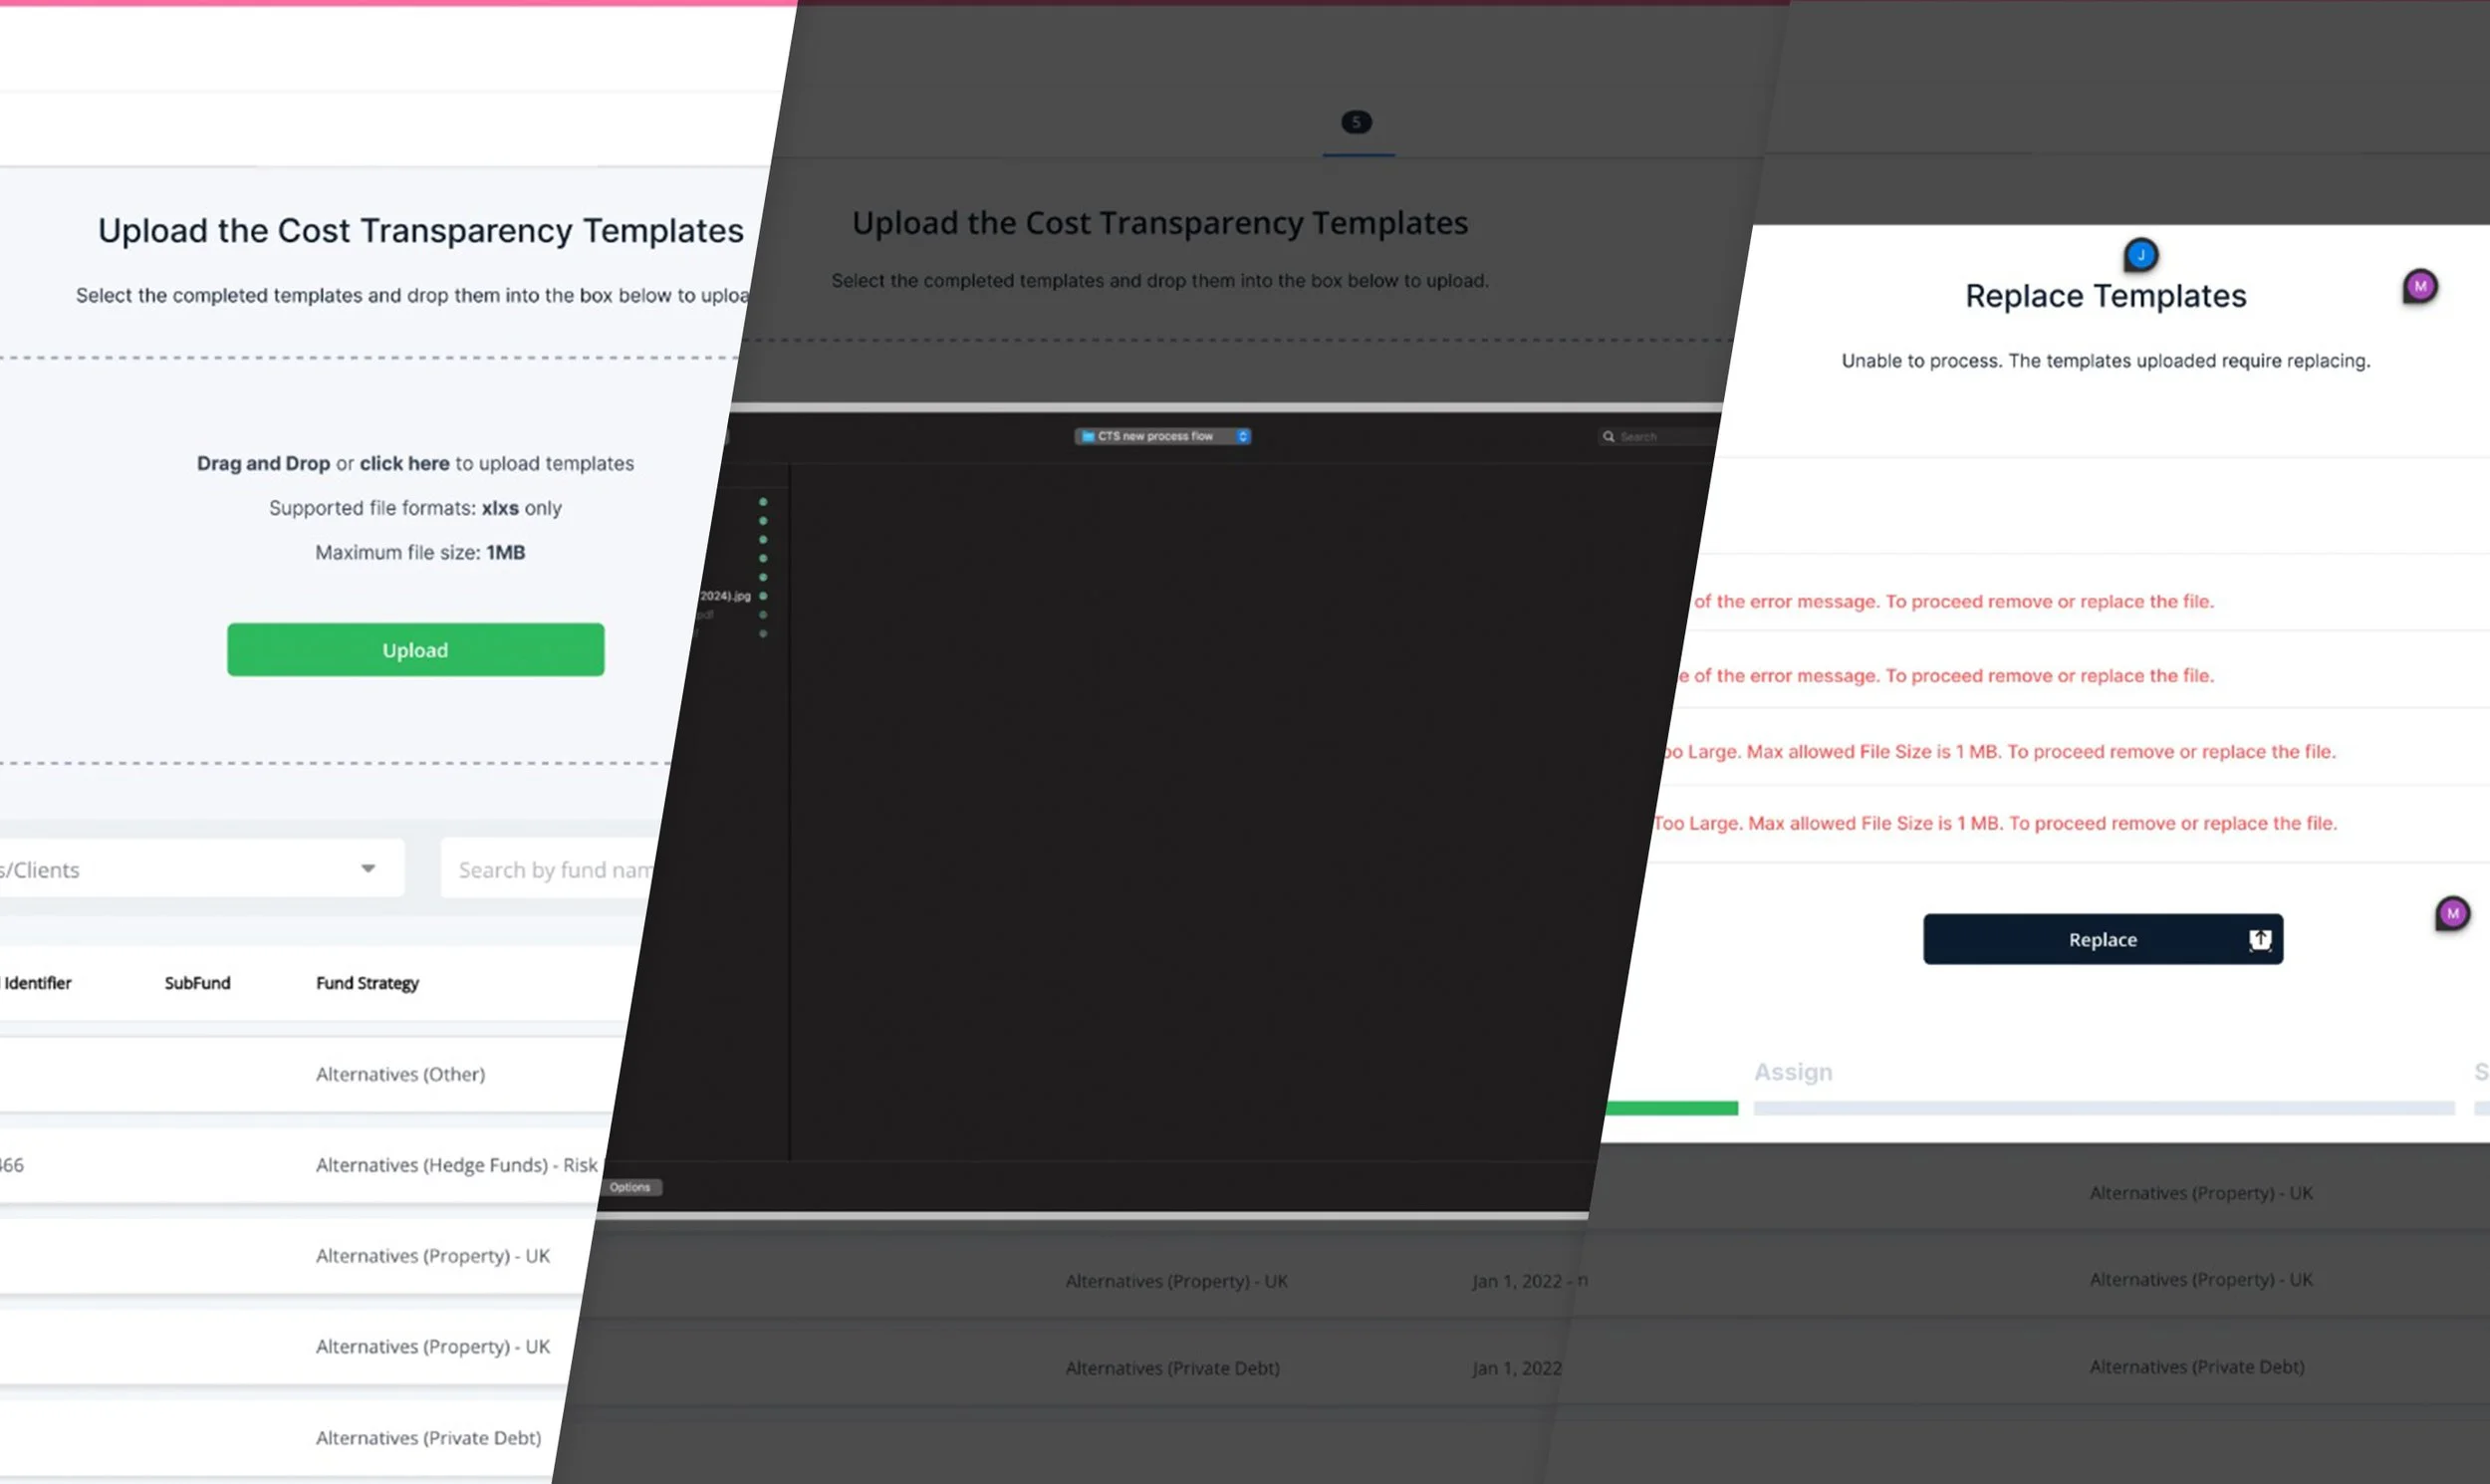
Asset managers could upload multiple files in various formats
Spreadsheet errors were common and difficult to detect early - there was no automated validation and patterns listed out
Invalid data often required manual intervention from internal teams
Fixing issues late in the process delayed report delivery to asset owners
At the same time, we had to carefully manage the trade-off between data integrity and user effort. Asset managers interacted with the platform infrequently, often under time constraints, which made them particularly sensitive to friction and complexity. The challenge was to introduce more structured and reliable data capture mechanisms while preserving a streamlined, low-effort submission flow that would not discourage engagement.
Key design activities planned over the time for this project
Team workshops
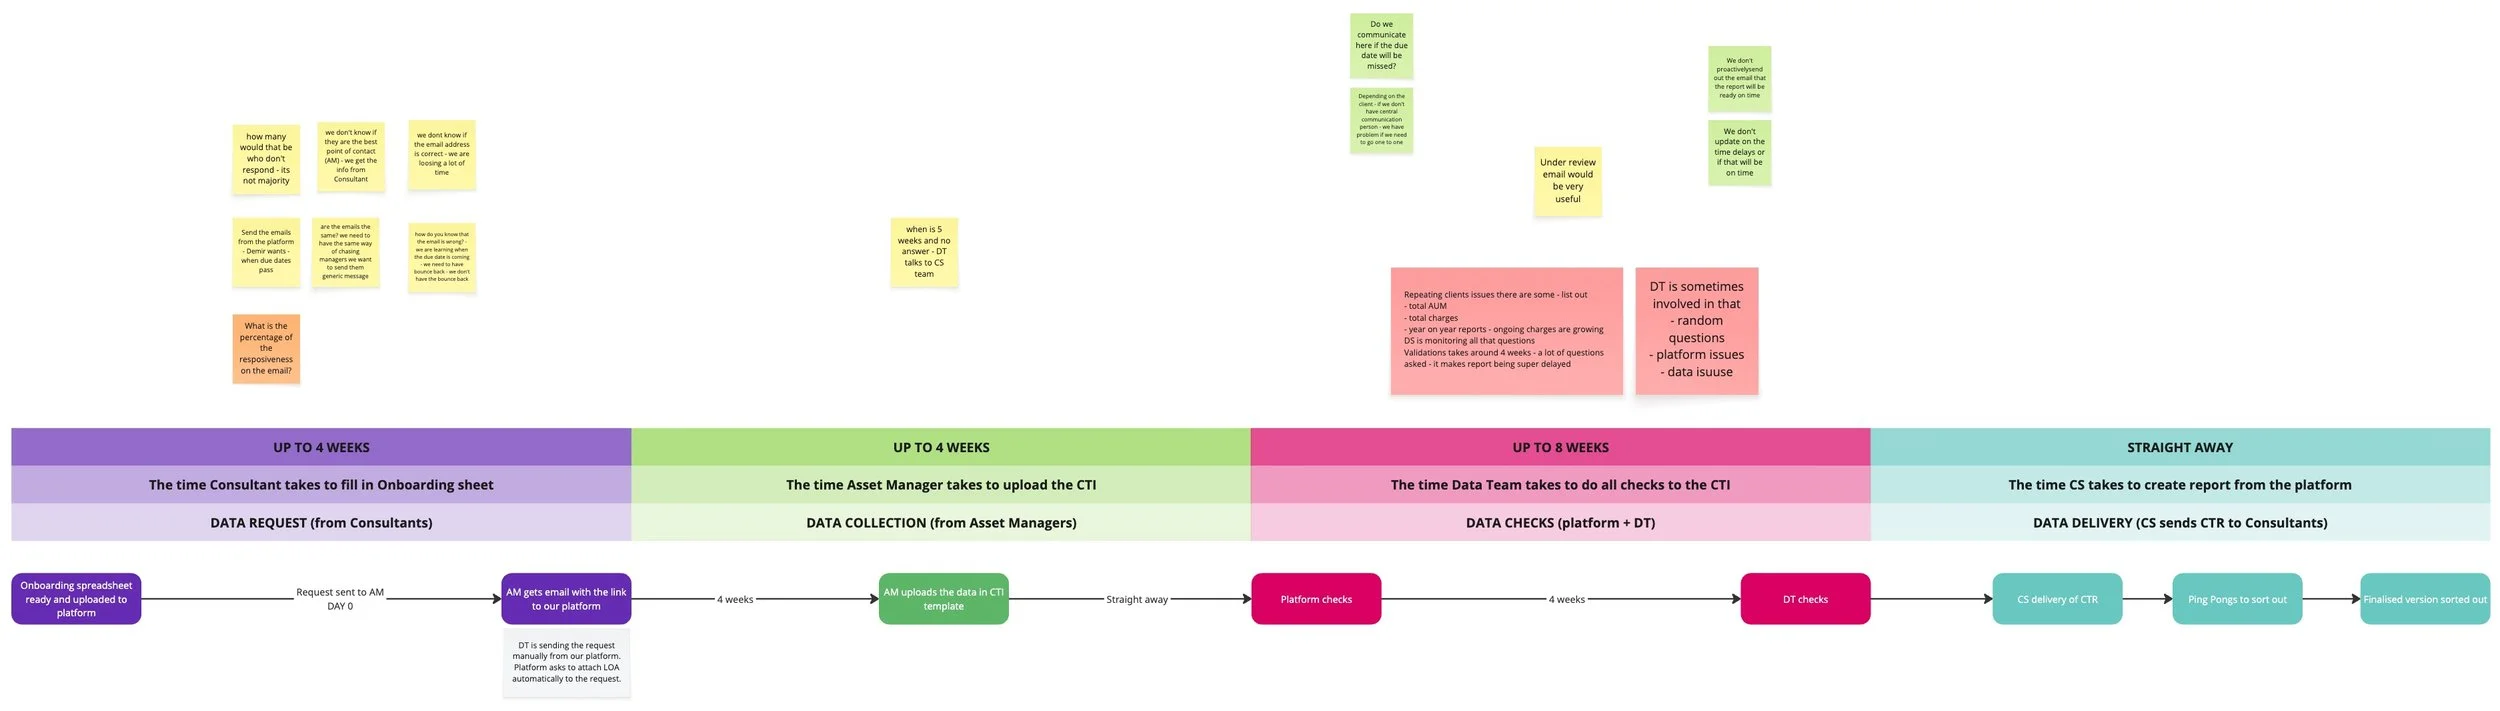
We gathered initial problems and ideas working with the different team membersJourney Mapping
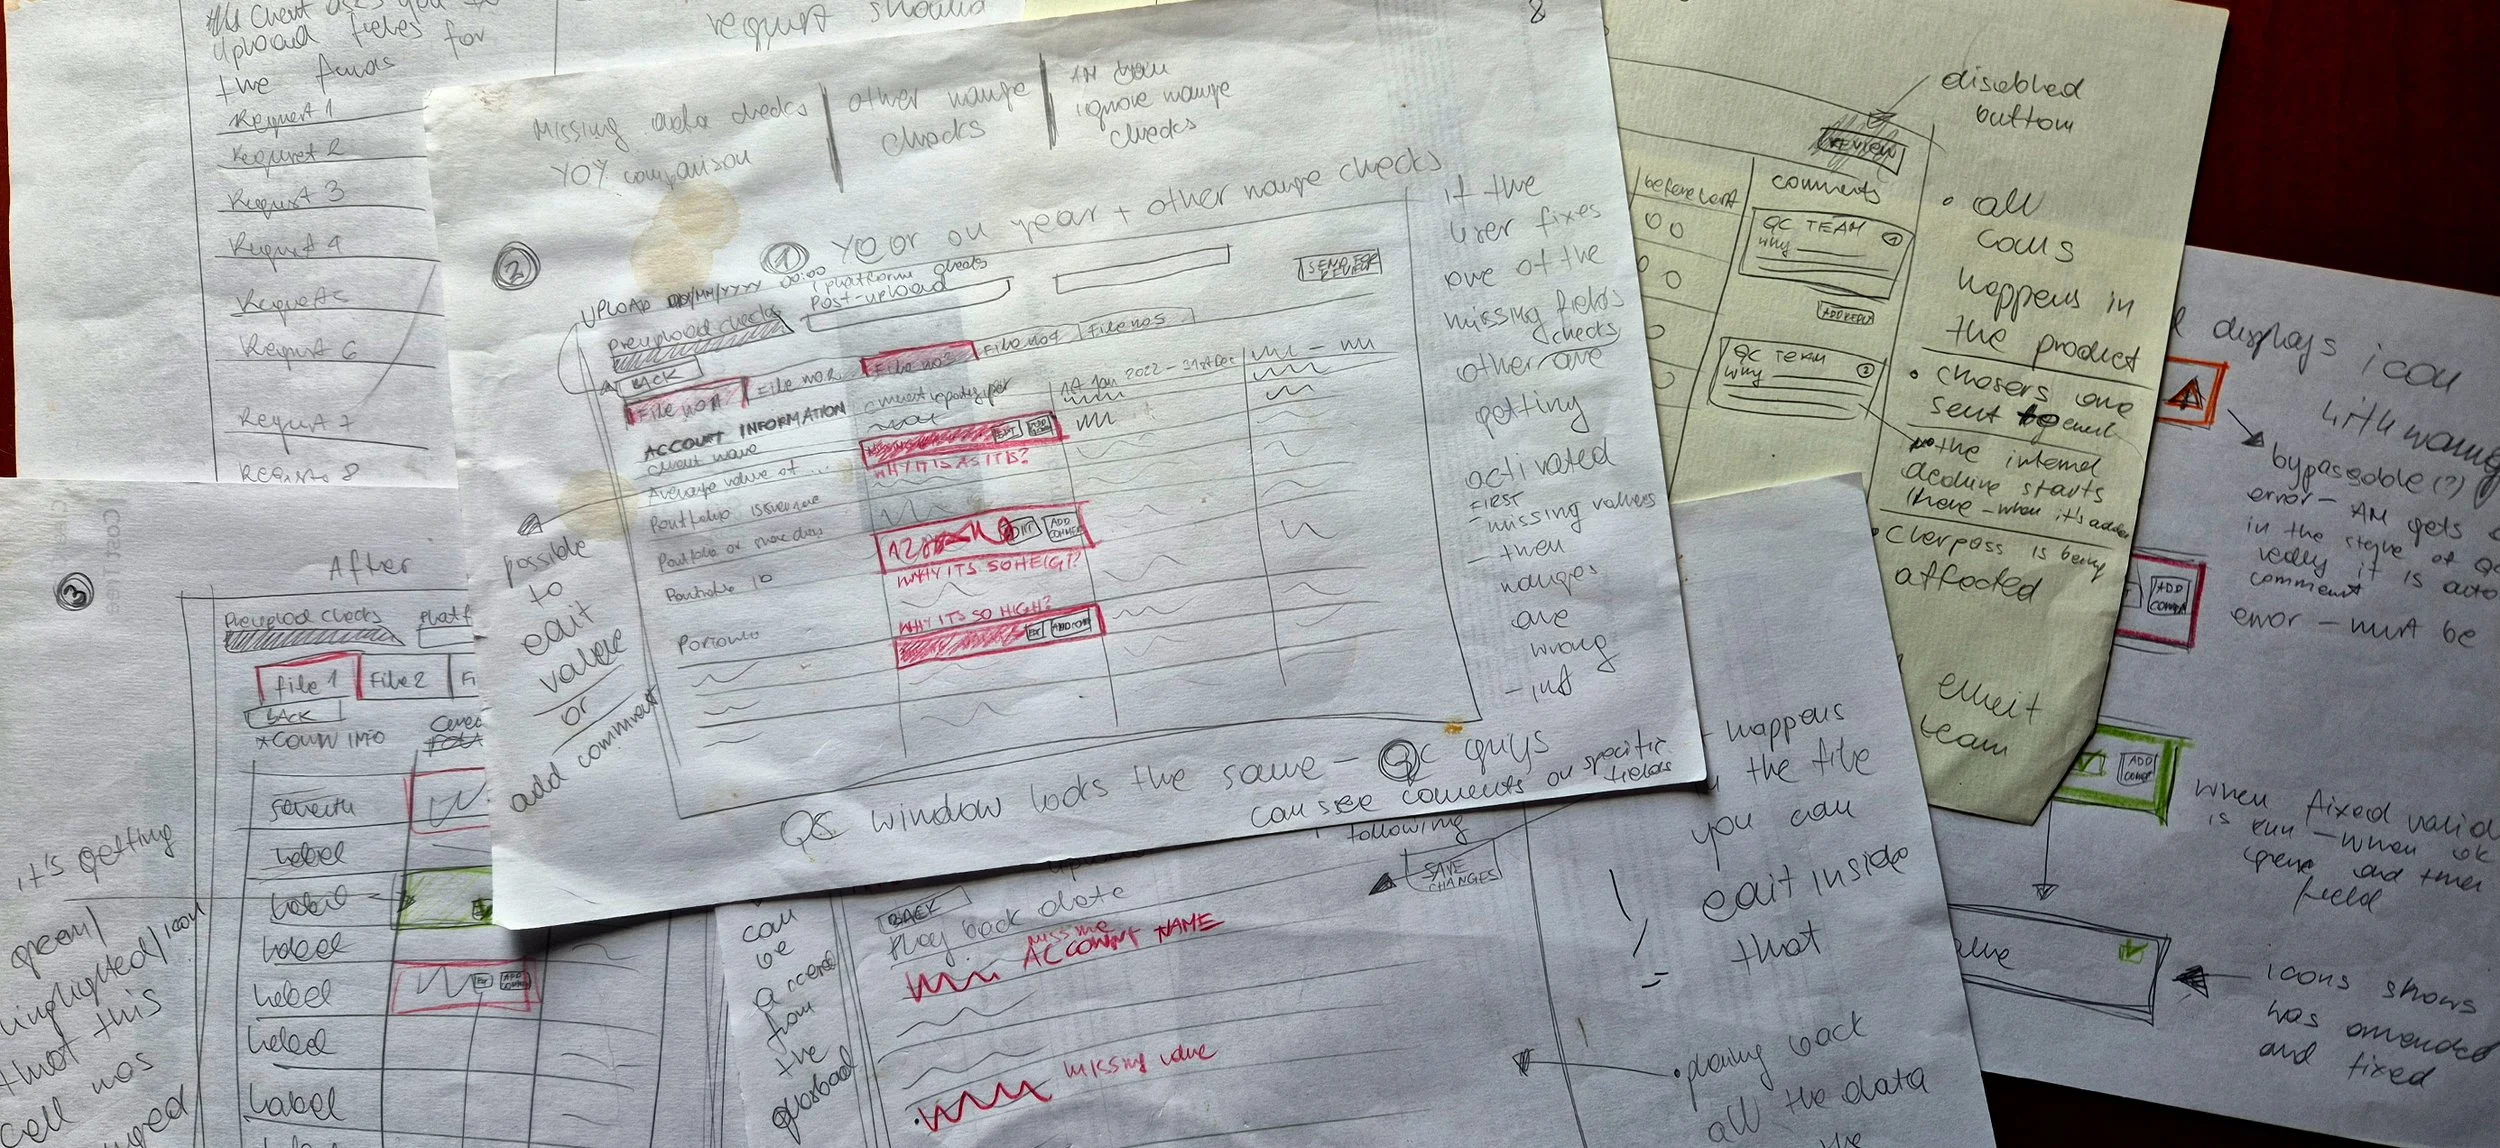
We mapped all micro-journeys within the submission flow to understand every possible outcome and edge case.Concept Sketching
Early sketches explored potential interaction models and submission structures.Wireframing
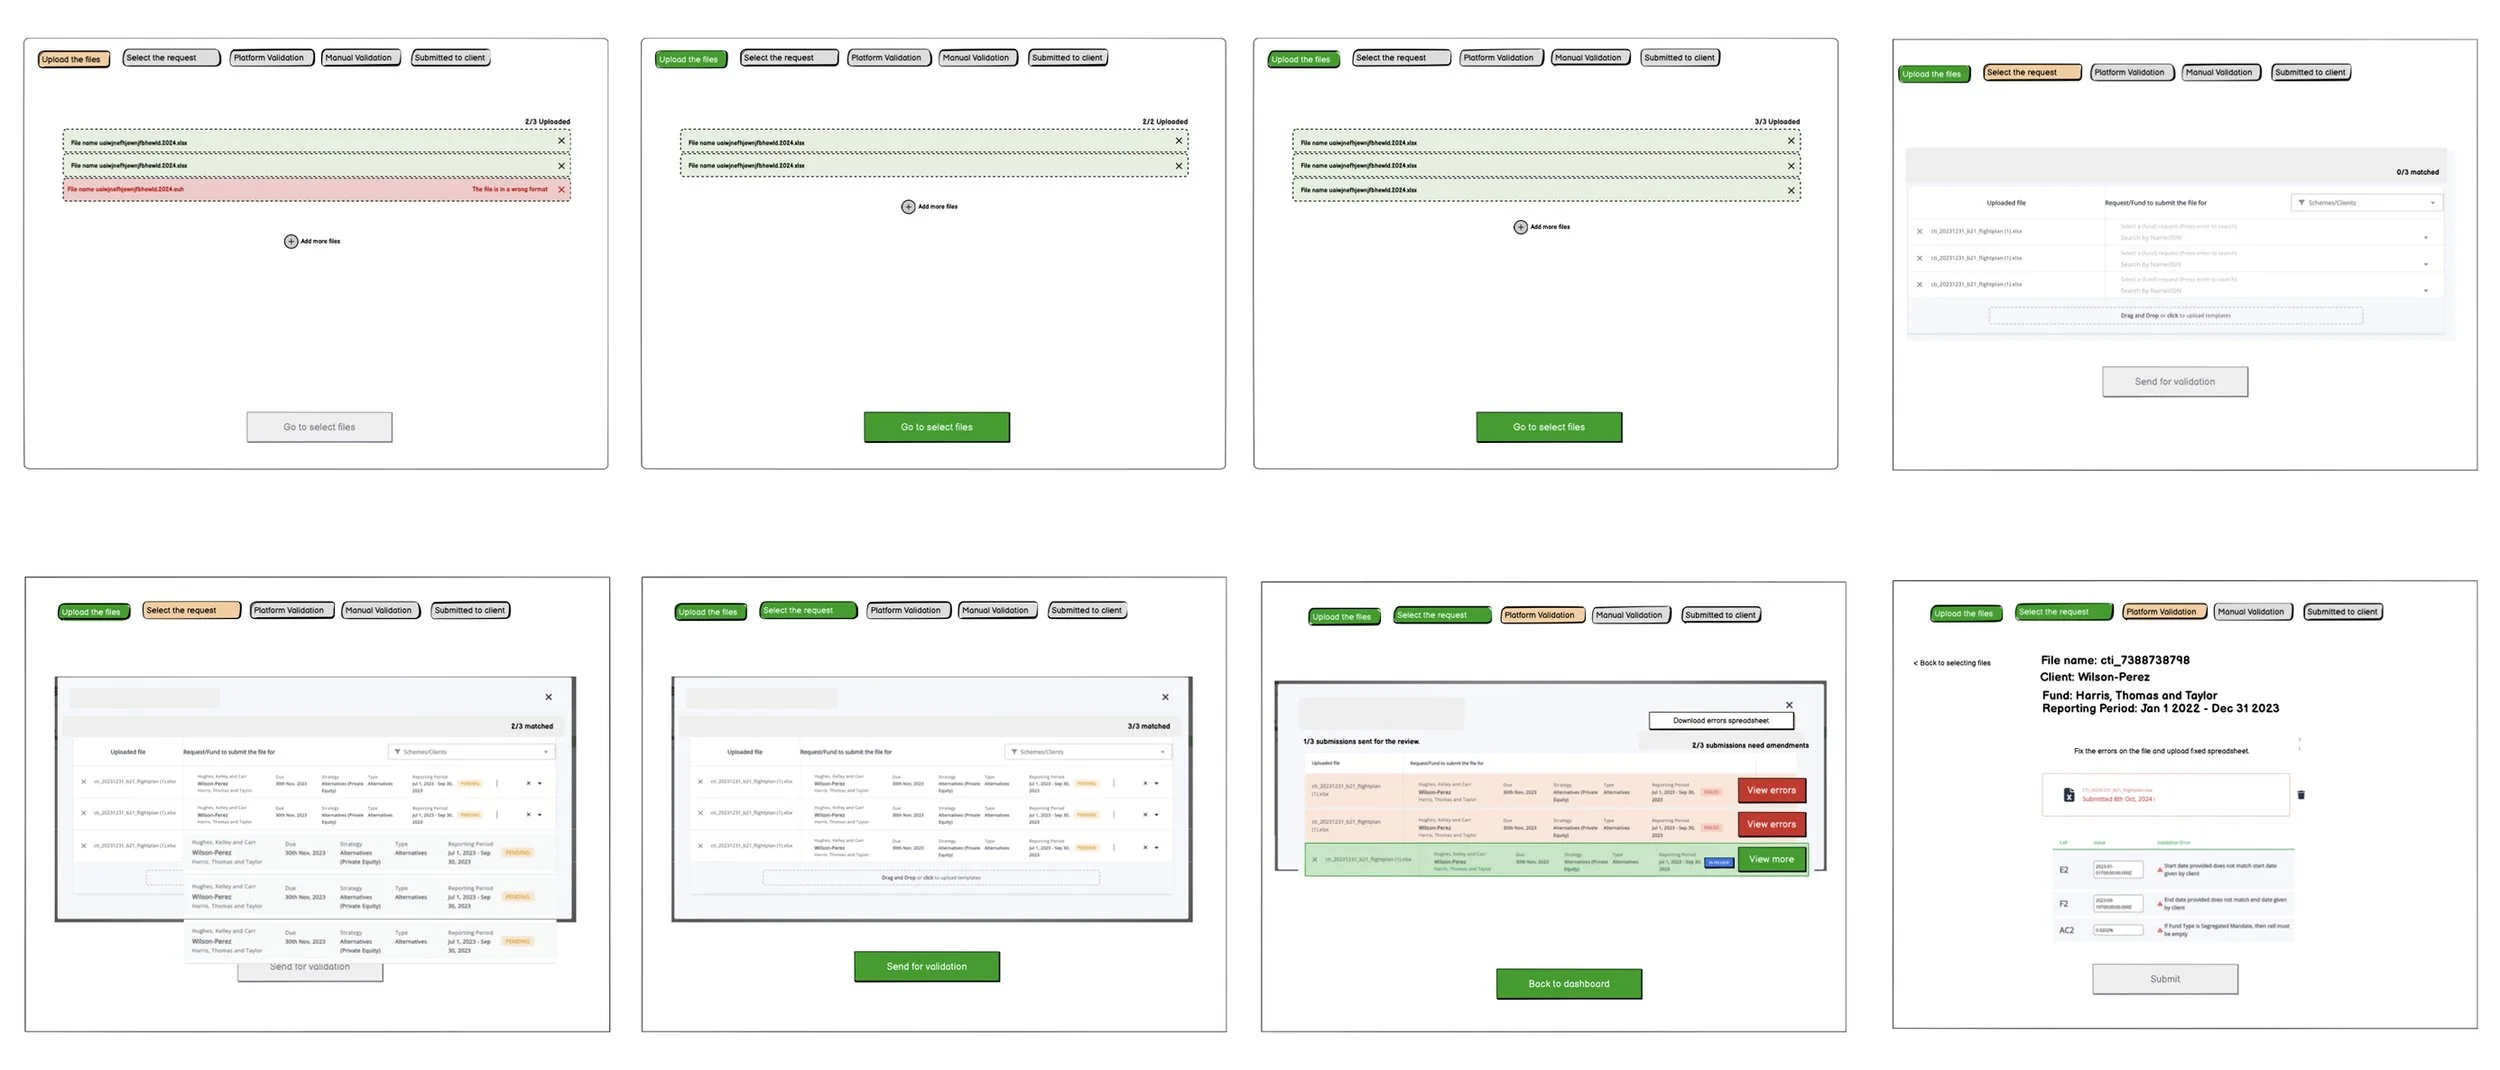
Multiple iterations of wireframes helped validate whether all scenarios and edge cases were properly addressed.High-Fidelity Design
The final designs were refined into detailed UI specifications to ensure smooth handoff to engineering and minimise ambiguity during development.
Key Constraints
The Asset Manager Upload Journey sat at the centre of a highly complex operational ecosystem responsible for collecting and processing cost transparency data across the UK and European asset management market. The workflow needed to support large-scale data ingestion from multiple asset managers, each operating with different reporting standards, levels of data maturity, internal processes, and file structures. Asset managers could upload multiple files simultaneously in a variety of formats, creating significant variability in both the quality and consistency of incoming data.
One of the core business challenges was balancing data quality requirements with operational efficiency. ClearGlass relied on highly accurate and standardised data to generate benchmarking insights and client reporting, meaning even small inconsistencies within uploaded spreadsheets could create substantial downstream validation and operational issues. At the same time, introducing excessive friction into the upload process risked slowing submissions and reducing engagement from asset managers, whose interaction with the platform was typically periodic and deadline-driven rather than continuous.
The platform also operated within strict annual reporting cycles, leaving very limited windows for product iteration, testing, and rollout. Improvements often needed to be designed, validated, and released rapidly within live environments while ensuring stability during high-pressure reporting periods. This seasonal characteristic of the industry created additional complexity, as opportunities for learning and optimisation only emerged during specific moments of the year.
Another major constraint was the interconnected nature of the wider product ecosystem. The upload journey was directly linked to multiple downstream workflows, including internal validation processes, communication between stakeholders, report generation, and client delivery. Every status, validation rule, and submission state needed to remain accurately synchronised across the platform to ensure operational transparency for asset managers, internal teams, and asset owners simultaneously.
Research and discovery also presented challenges. Asset managers were often difficult to access directly for continuous feedback due to the infrequent nature of their platform usage and the operational pressure surrounding reporting periods. As a result, product decisions relied on a combination of limited user interviews, behavioural analytics tools such as Mixpanel and Hotjar, insights from customer-facing teams, and operational feedback from internal data specialists.
Finally, the product needed to be designed not only as a functional upload tool, but as a scalable foundation for future platform capabilities. Validation logic, communication flows, status visibility, and automation opportunities all needed to be considered early in the design process to ensure the journey could evolve into a more connected and intelligent ecosystem over time.
Industry reporting cycles
The asset management industry operates within strict annual reporting windows, meaning product improvements could only be tested and iterated during specific periods each year.Diverse data formats
Asset managers submitted data in multiple spreadsheet structures and file types, creating a wide range of potential errors and edge cases.Limited user access for research
Asset managers were relatively difficult to engage directly, requiring the team to rely on proxy insights from customer success teams and behavioural analytics.Highly variable usage patterns
Larger clients submitted significantly more files and interacted with the platform more frequently, while smaller firms engaged only occasionally. The design needed to support both high-volume and low-frequency users effectively.
Research & Discovery
Direct access to asset managers was limited, so we relied on multiple complementary data sources to understand user behaviour:
Insights from customer success and account management teams
Behavioural analytics using Mixpanel and Hotjar
Observation of real submission flows within the platform
Internal workshops with teams supporting and meeting asset managers
These insights helped us identify the most common friction points in the upload journey, particularly around file errors, validation delays, and unclear feedback during submission. Because usage was periodic and traffic volumes relatively low compared to consumer faced products, analytics-driven iteration became a crucial part of the design process.
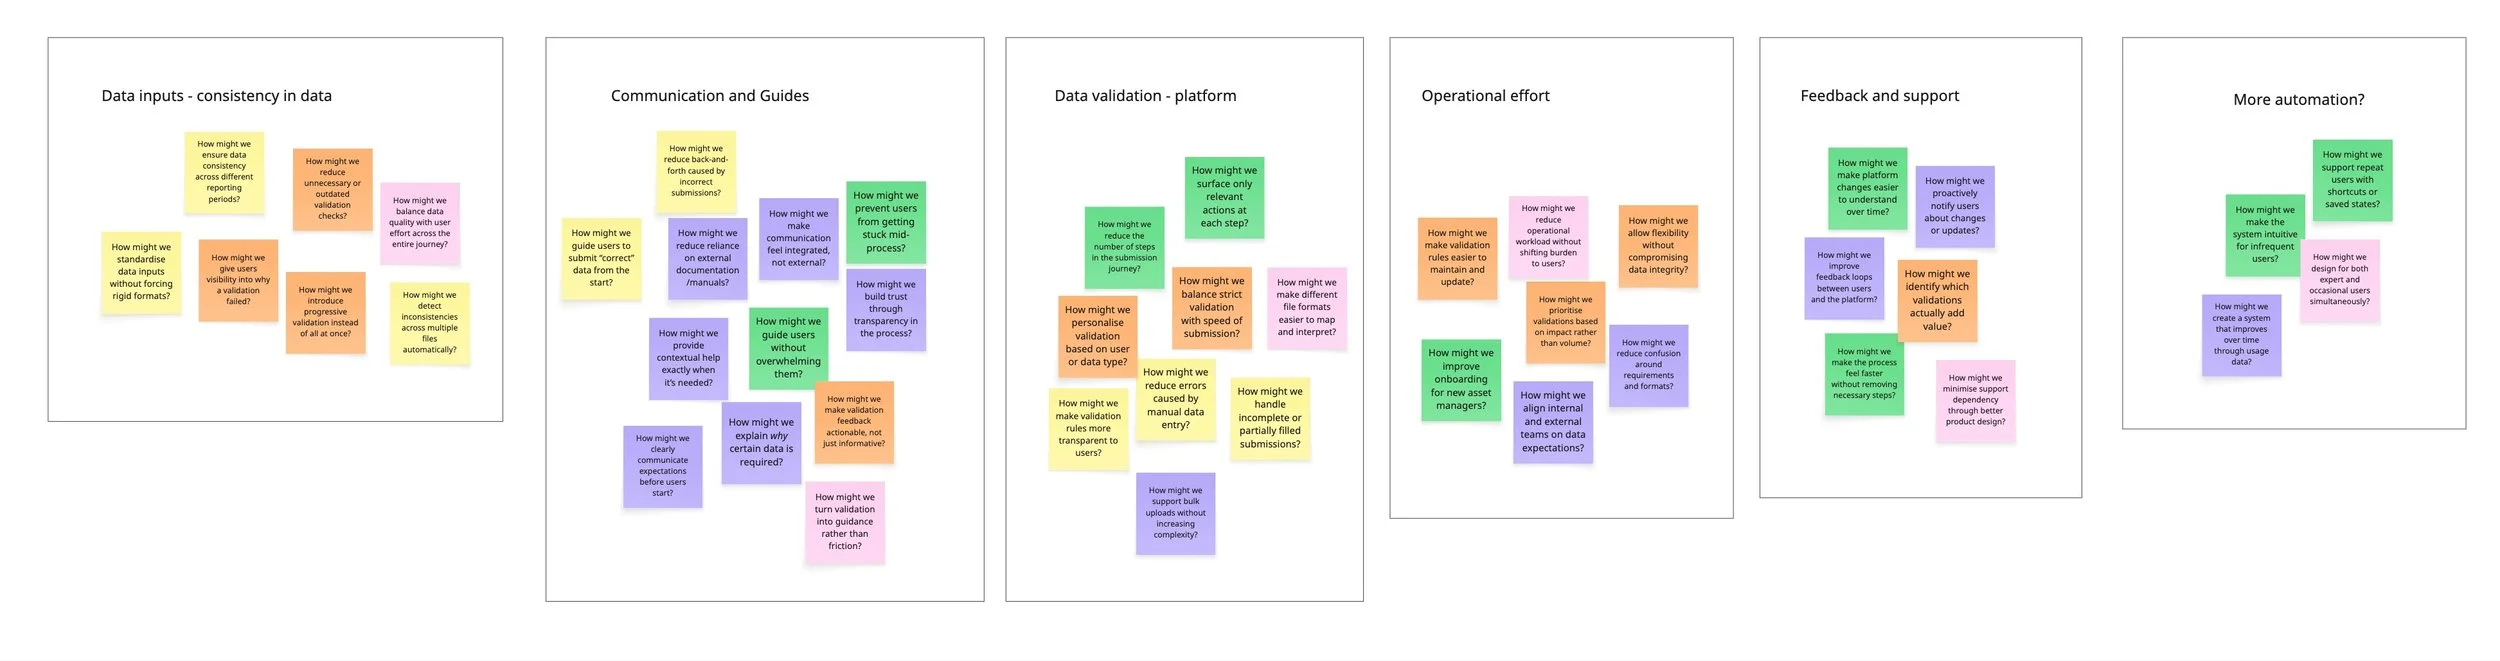
The Design Challenge
The primary challenge was to design a flexible submission system capable of handling many scenarios, including:
multiple file uploads
different data structures
incomplete submissions (which were still used and passed on to the other end)
spreadsheet validation errors
varying levels of user experience
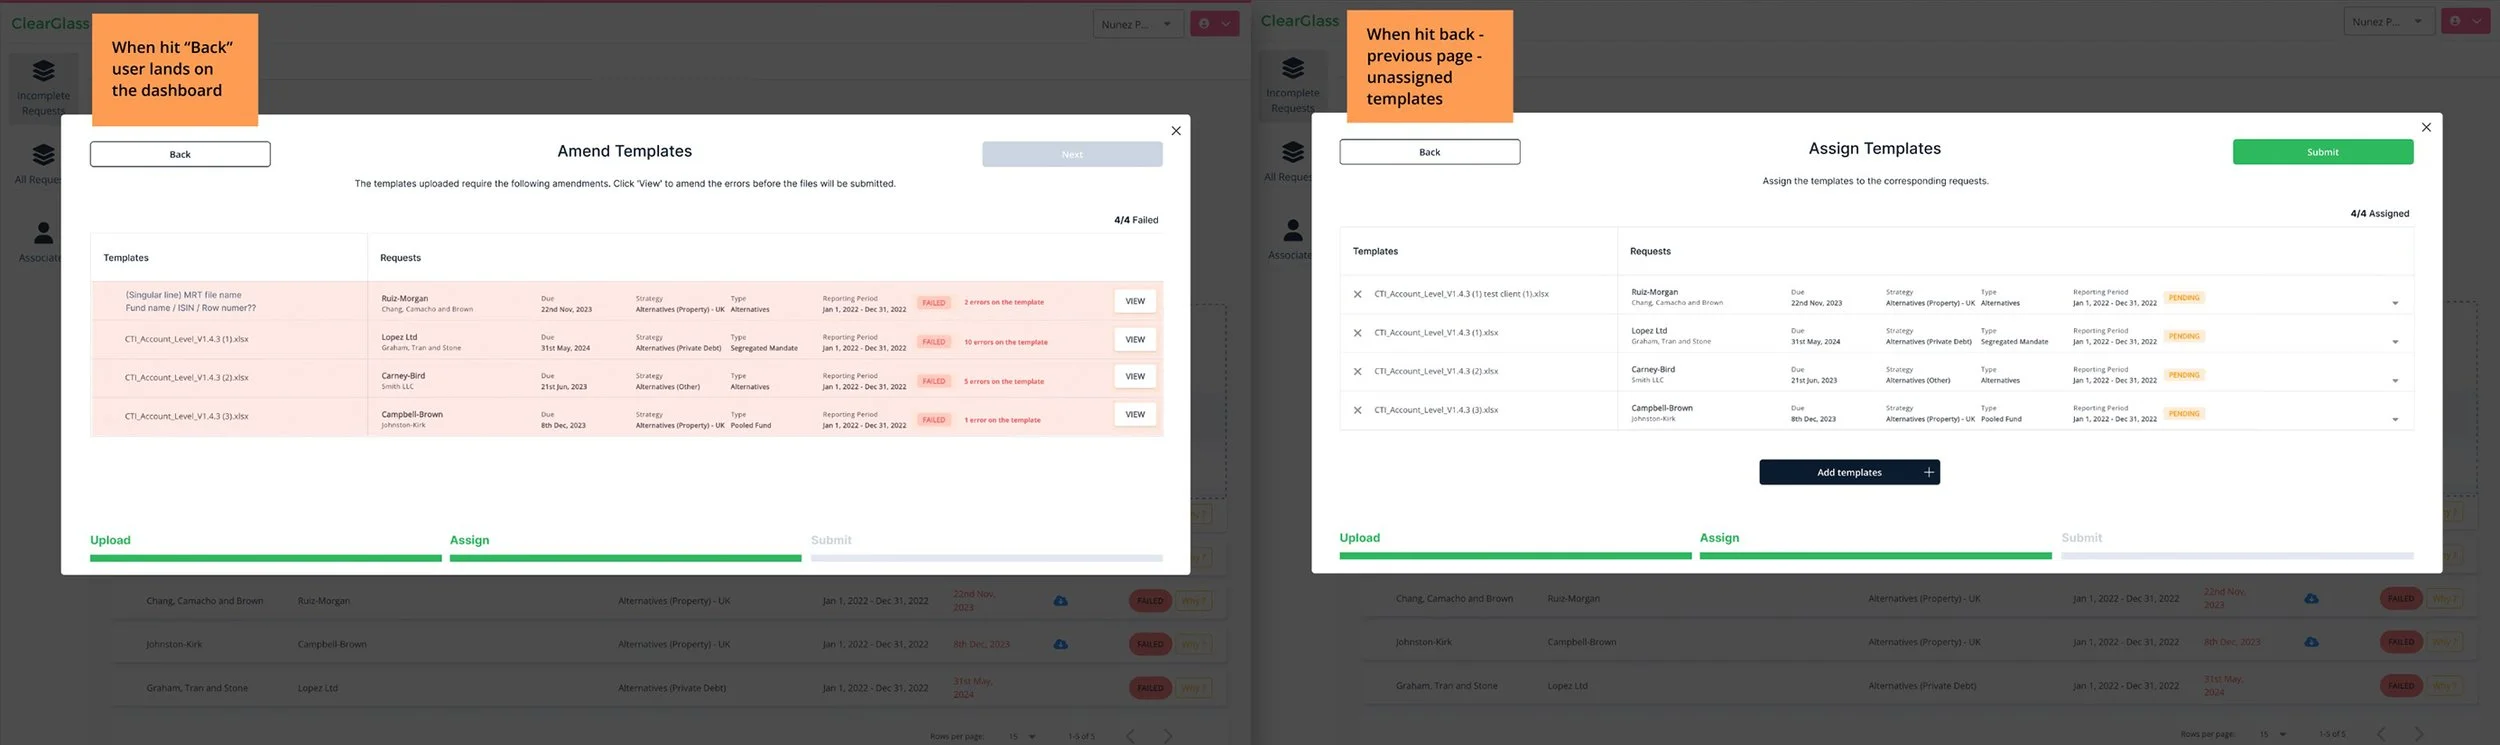
The workflow needed to remain efficient and intuitive, while also ensuring that data entering the platform met the required quality standards. I covered in design all edge cases as because the upload process was pretty complex with overlaying loops of interactions. The idea was as well to make product to “remember” where the user ended up his submission so they could easily pick up on that particular step for the specific spreadsheet.

Iterative Product Development
Because of the industry’s reporting cycles, the solution evolved through multiple product iterations. Based on the constant research from the live environment we opted in for the cycles to improve the product. We divided project into the following stages:
MVP Initial Data Ingestion
The first iteration focused on solving the most immediate need: allowing asset managers to upload data files directly into the platform.
This initial ingestion tool provided a structured entry point for submissions but still relied heavily on internal teams to detect and correct errors later in the process.UI-Based Data Validation
The next iteration introduced real-time validation at the interface level.Instead of relying solely on internal teams to identify issues, asset managers could now:receive feedback on submission errors
correct mistakes before completing the upload
resubmit improved datasets directly
This significantly reduced the need for manual intervention and improved the quality of incoming data. We focused solely on those points instead of trying to craft the ideal user experience.
Structured Question Framework
Further research revealed that many issues stemmed from unclear or inconsistent responses from asset managers. To address this, we introduced a structured set of submission questions, designed in collaboration with internal stakeholders.
The goal was to:
standardise responses
reduce ambiguity in submitted data
improve consistency across asset manager submissions
This iteration further improved the reliability of the data entering the platform. We identified the answer patterns and we were able to create the list of answers which significantly reduced the internal team efforts in understanding the external users issues. Also the file ingestion was the foundation for the future feature which bas focused around the automation and patterns recognition in the data uploaded to the platform.
Post-MVP Redesigns
During the upload cycle we redesigned the flow based on the feedback we got from our users. The iterations were short and fast to make sure that improvements will arrive ass soon as possible for the likes of our users and clients. After observing the workflow, we identified an opportunities to redesign the journey more comprehensively.
This phases involved continous:
mapping more possible submission scenarios and edge cases
documenting the more complex complete end-to-end journey
designing workflows capable of supporting a broader range of file types and submission behaviours in the preparation for the future pattern recognition engine
Impact
The redesigned submission journey produced measurable improvements across the platform:
Increased number of successful submissions
Faster data upload and validation workflows
Reduced reliance on customer and data teams to resolve submission issues
Highly accelerated delivery of reports to asset owners
By improving the efficiency and reliability of data ingestion, the project contributed directly to faster reporting cycles and increased operational scalability for the platform.
Project Summary
The Asset Manager Upload Journey was a core part of the ClearGlass platform ecosystem, responsible for enabling asset managers to submit large volumes of cost transparency and performance data into the system. The journey acted as the primary entry point into the wider reporting pipeline, directly influencing downstream validation workflows, stakeholder communication, report generation, and final delivery to asset owners and pension schemes.
The project focused on improving the quality, scalability, and operational efficiency of the submission experience while balancing the needs of multiple sides of the market. Asset managers operated with highly variable data structures, reporting standards, and submission behaviours, creating significant complexity in designing a workflow that remained flexible without compromising consistency and data integrity.
Rather than treating the upload experience as a standalone feature, the work evolved into designing a more connected ecosystem where submission statuses, validation logic, communication layers, and reporting readiness remained synchronised across the platform. The project required continuous iteration within strict annual reporting cycles, combining product discovery, systems thinking, operational insight, and rapid delivery in a highly specialised and data-intensive B2B environment.