
ClearGlass Analytics is an independent data analytics company that enables asset owners, investment advisors, and asset managers to evaluate the Value for Money (VfM) of their investments through transparent cost and performance data.
As part of the product team, I contributed to the development of a SaaS platform designed to serve all sides of the asset management market, delivering structured cost transparency and advanced analytics across the UK and European investment ecosystem. The platform integrates industry frameworks such as the Cost Transparency Initiative (CTI) and the Cost Transparency Standard (CTS), enabling consistent data collection, benchmarking, and more informed investment decision-making.
Designing for this product presented unique challenges due to the highly cyclical nature of the industry. The platform operates around critical annual reporting cycles that determine when new features, improvements, and data submissions can be tested and adopted by users. These overlapping cycles created a distinctive product development rhythm and required careful prioritisation to ensure the platform evolved without missing key market opportunities. As one of the first platforms of its kind, the product played a pioneering role in bringing transparency and benchmarking capabilities to the asset management industry.
The organisation operated with a strong product-led mindset, with well-informed stakeholders actively collaborating across teams. Continuous experimentation, research, and rapid shifts in focus were embedded in the company culture, creating a fast-paced environment where multiple teams ran parallel initiatives to validate ideas and improve the product.
Conducting UX research in this domain presented additional complexity. Many users interacted with the platform only periodically during reporting cycles rather than daily, which made recruitment and engagement more difficult. To overcome this, we conducted regular user interviews (approximately every two weeks) and supplemented qualitative insights with internal data analysis and feedback from customer-facing teams. Asset owners were generally more open to participation than asset managers, which influenced our research strategy.
We triangulated insights from multiple sources to inform design decisions, combining user feedback with behavioural data from analytics tools such as Google Analytics, Hotjar, and Mixpanel. These insights were shared across the organisation on an ongoing basis, ensuring that product development remained aligned with real user needs and market dynamics.
Asset Owner Portal - Consultant Dashboard
The dashboard served as the primary interface for organisations collaborating with ClearGlass, including DB and DC pension schemes, fiduciary managers, and other asset owners like consultants. It provided visibility into the progress of cost and charges data collection across individual pension schemes and funds, allowing stakeholders to monitor submission status and data completeness throughout reporting cycles.
Rather than redesigning the system from the ground up, our work focused on progressive refinement of an already established product architecture. Through a series of iterative improvements, we enhanced clarity, usability, and information hierarchy to make complex data more accessible and interpretable for asset owners.
This involved introducing targeted micro-features and functional enhancements that improved transparency and workflow efficiency. While each change was relatively small in scope, collectively these iterations significantly improved the overall user experience and supported more effective monitoring of data collection across the platform.
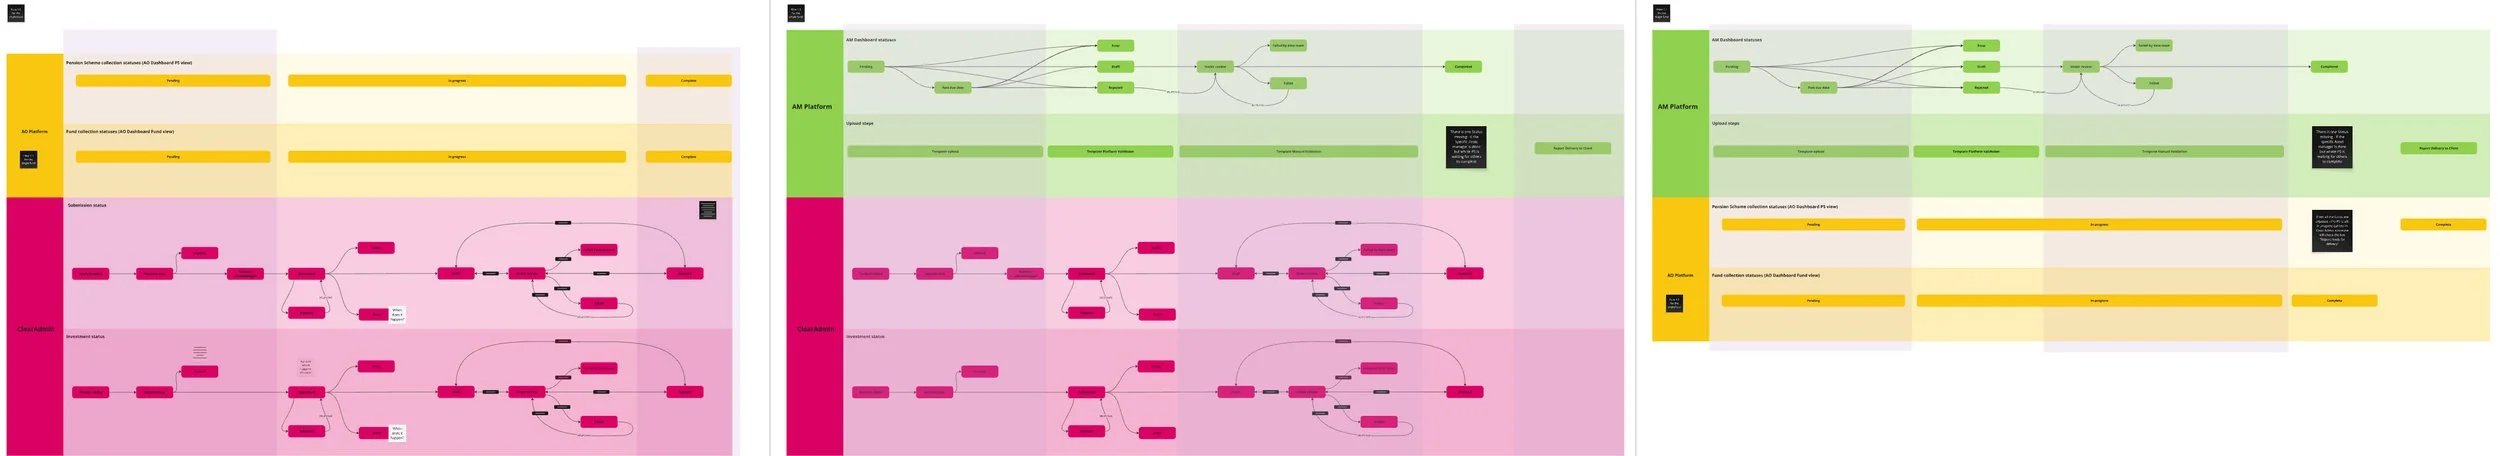
One of the more challenging aspects of the work was ensuring strong interconnectedness between all parts of the platform ecosystem. The dashboard statuses were not standalone indicators - they acted as reflections of multiple underlying workflows happening across different areas of the product, including asset manager submissions, internal validation processes, communication flows, report generation, and final delivery stages. Designing this level of interconnected visibility required careful mapping of dependencies, operational edge cases, and status logic to ensure consistency and accuracy across the platform. As the ecosystem evolved, maintaining alignment between these moving parts became a critical product challenge, requiring continuous collaboration across product, data, operational, and engineering teams to ensure the platform remained coherent, scalable, and trustworthy for all sides of the market.
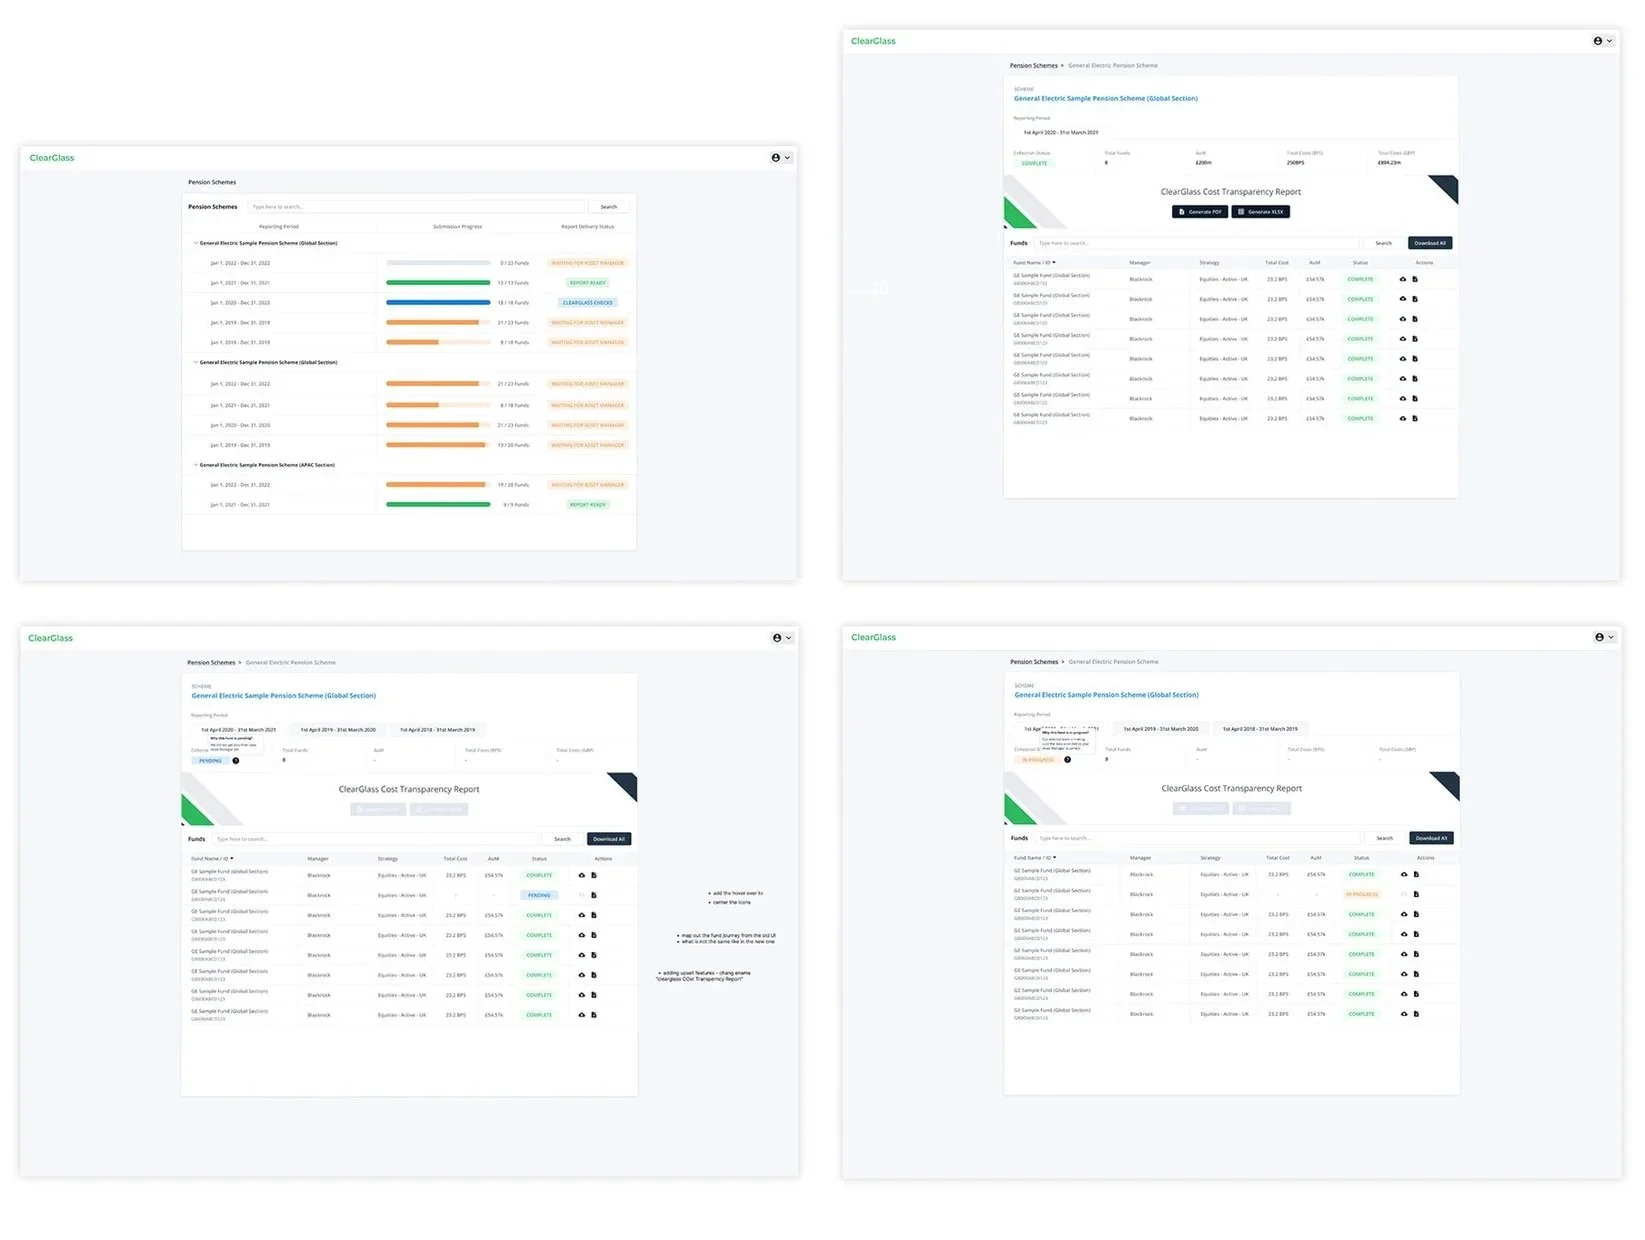
Key Improvements
Some of the key improvements included:
Introducing submission progress tracking, allowing asset owners to monitor how many funds had been submitted, reviewed, and validated by asset managers and internal teams. This provided much greater visibility into reporting readiness and enabled partially completed reports to be generated when required by pension scheme clients.
Adding report delivery statuses to distinguish between collected data and fully validated, report-ready outputs. This helped stakeholders better understand where delays or dependencies existed within the reporting cycle.
Expanding detailed fund-level statuses to surface more granular operational states, such as pending submissions, incomplete data, validation blockers, or requests for additional information. This significantly improved issue identification and follow-up workflows.
Introducing contextual actions such as downloadable fund details for both completed and pending submissions, enabling users to investigate issues further and take appropriate next steps directly from the dashboard experience.
A key aspect of the work was designing with the wider ecosystem in mind. Each workflow within the platform - submission, validation, communication, and reporting - directly influenced another. The dashboard therefore became more than a reporting surface; it evolved into a central coordination layer helping different sides of the market understand progress, dependencies, and operational status across the entire data collection lifecycle.