
ClearGlass Analytics is an independent data analytics company that enables asset owners, investment advisors, and asset managers to evaluate the Value for Money (VfM) of their investments through transparent cost and performance data.
As part of the product team, I contributed to the development of a SaaS platform designed to serve all sides of the asset management market, delivering structured cost transparency and advanced analytics across the UK and European investment ecosystem. The platform integrates industry frameworks such as the Cost Transparency Initiative (CTI) and the Cost Transparency Standard (CTS), enabling consistent data collection, benchmarking, and more informed investment decision-making.
Designing for this product presented unique challenges due to the highly cyclical nature of the industry. The platform operates around critical annual reporting cycles that determine when new features, improvements, and data submissions can be tested and adopted by users. These overlapping cycles created a distinctive product development rhythm and required careful prioritisation to ensure the platform evolved without missing key market opportunities. As one of the first platforms of its kind, the product played a pioneering role in bringing transparency and benchmarking capabilities to the asset management industry.
The organisation operated with a strong product-led mindset, with well-informed stakeholders actively collaborating across teams. Continuous experimentation, research, and rapid shifts in focus were embedded in the company culture, creating a fast-paced environment where multiple teams ran parallel initiatives to validate ideas and improve the product.
Conducting UX research in this domain presented additional complexity. Many users interacted with the platform only periodically during reporting cycles rather than daily, which made recruitment and engagement more difficult. To overcome this, we conducted regular user interviews (approximately every two weeks) and supplemented qualitative insights with internal data analysis and feedback from customer-facing teams. Asset owners were generally more open to participation than asset managers, which influenced our research strategy.
We triangulated insights from multiple sources to inform design decisions, combining user feedback with behavioural data from analytics tools such as Google Analytics, Hotjar, and Mixpanel. These insights were shared across the organisation on an ongoing basis, ensuring that product development remained aligned with real user needs and market dynamics.
Internal Data Validation Tool
Designing an operational platform to improve data accuracy and efficiency.
Overview
ClearGlass Analytics delivers transparent cost and performance data across the UK and European asset management market. A critical part of this process involves validating large volumes of data submitted by asset managers before it becomes available to clients. Prior to this initiative, the internal data team relied on a fragmented collection of external tools - ranging from excel spreadsheets to generic jira software and emails - which made the workflow inefficient, difficult to scale, and heavily manual.
Given that data accuracy is central to ClearGlass’ value proposition, the operational pressure on the internal team was significant. The absence of an integrated validation workflow increased both the cognitive and administrative load required to review submissions, creating inefficiencies and a higher risk of inconsistencies across the process.
To address these challenges, we designed a dedicated internal validation tool fully integrated into the platform. The solution enabled the team to review, validate, and manage submissions more efficiently while maintaining the high standards of accuracy expected by clients. Beyond improving operational efficiency, the tool also established stronger foundations for future automation, communication workflows, and wider ecosystem integration across the platform.
The Problem
Before the project:
The data validation workflow relied on spreadsheets and disconnected tools
Processes were manual, fragmented, and time-consuming
Reviewing submissions required switching between multiple systems
Operational complexity and time increased during annual reporting cycles
Because ClearGlass positions itself as a trusted data provider, maintaining accuracy and efficiency was critical. The existing workflow placed significant pressure on the internal team and was not scalable as the company grew. Multi layer complexity project was actually looked at from two main angles - the internal engine to make the work faster and eaier for the internal teams but also what kind of the data and how they are getting ingested into the product and how to actually manage and organise them in the patterns, what kind of the automation can be done to it. It was multiti stages and multi product managers product with a high complexity.
My Role
Responsibilities included:
Conducting user research with internal teams
Mapping workflows and operational processes with the product manager assigned on that project
Designing wireframes and interactive prototypes
Running usability testing sessions with the team
Collaborating with product managers and engineers to deliver the MVP
Supporting post-launch iteration and optimisation
Key Constraints
This project was shaped by several unique constraints:
Industry cycles
Asset management reporting follows strict annual cycles. Missing these windows would delay improvements by an entire year.Data accuracy requirements
Even small inconsistencies in submitted data would impact client reporting and benchmarking.Complex workflows
The validation process involved multiple review stages and required clear visibility of submission status.Specialised users
The internal data team had deep domain knowledge but limited access to purpose-built tools.Possibility of further developing in many not-yet-known directions
The product supposed to be a base for the further discovery and automation of all or most of the processes.
Research & Discovery
To quickly align stakeholders and explore solutions, we conducted a series of cross-functional workshops. To begin on the idea we run a week long Design Sprint Workshop with the team members of all the others departments involved in the process. Outcome of that exercise was MVP of the product which was usable and feasible.
Participants included:
Product and design team members
Engineering representatives
Internal data team (primary users)
Customer-facing teams
Key research activities
We used several product discovery methods:
Proto-personas to capture internal user needs
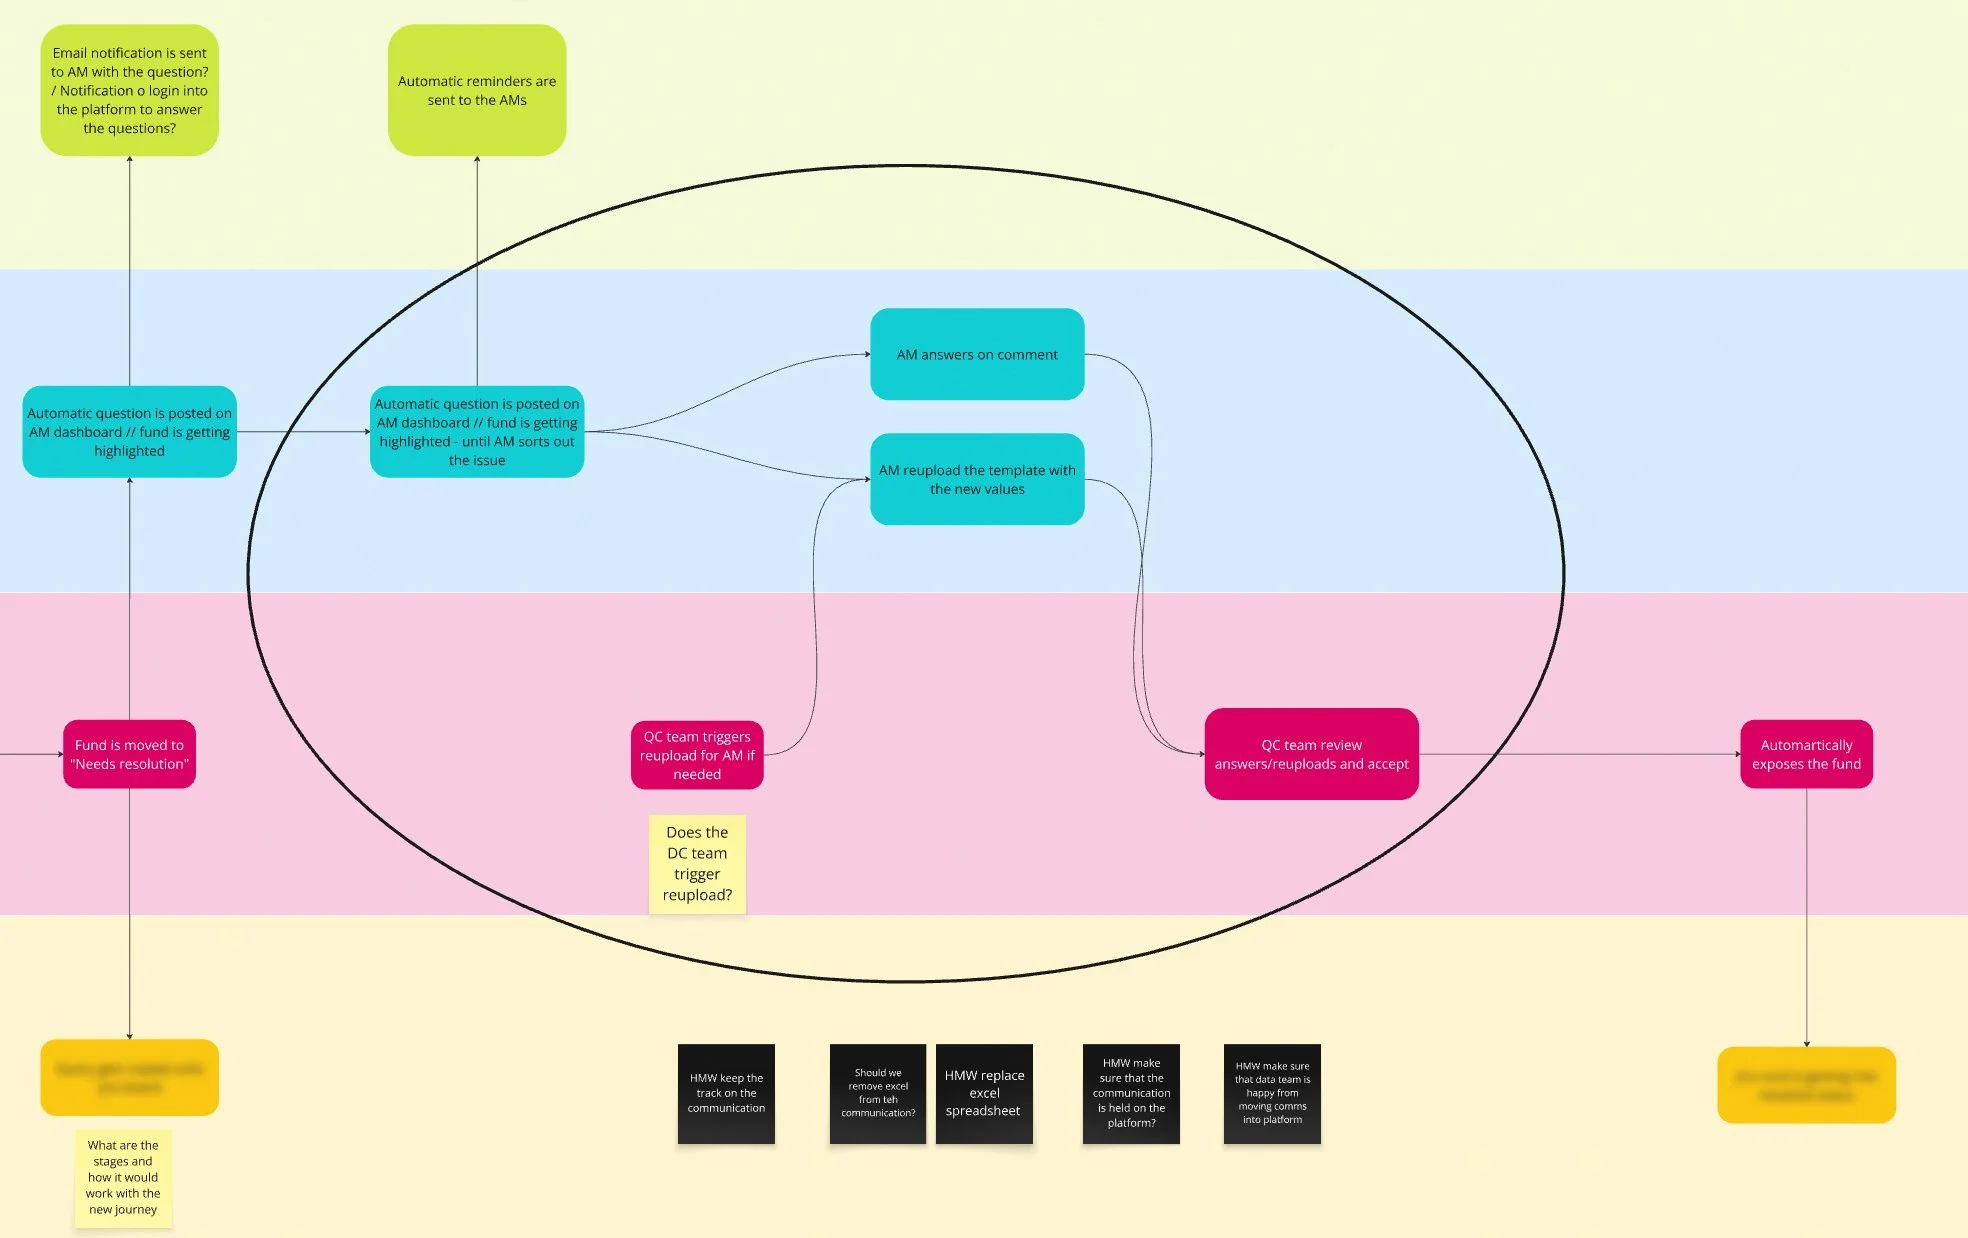
Journey mapping to visualise the existing validation workflow
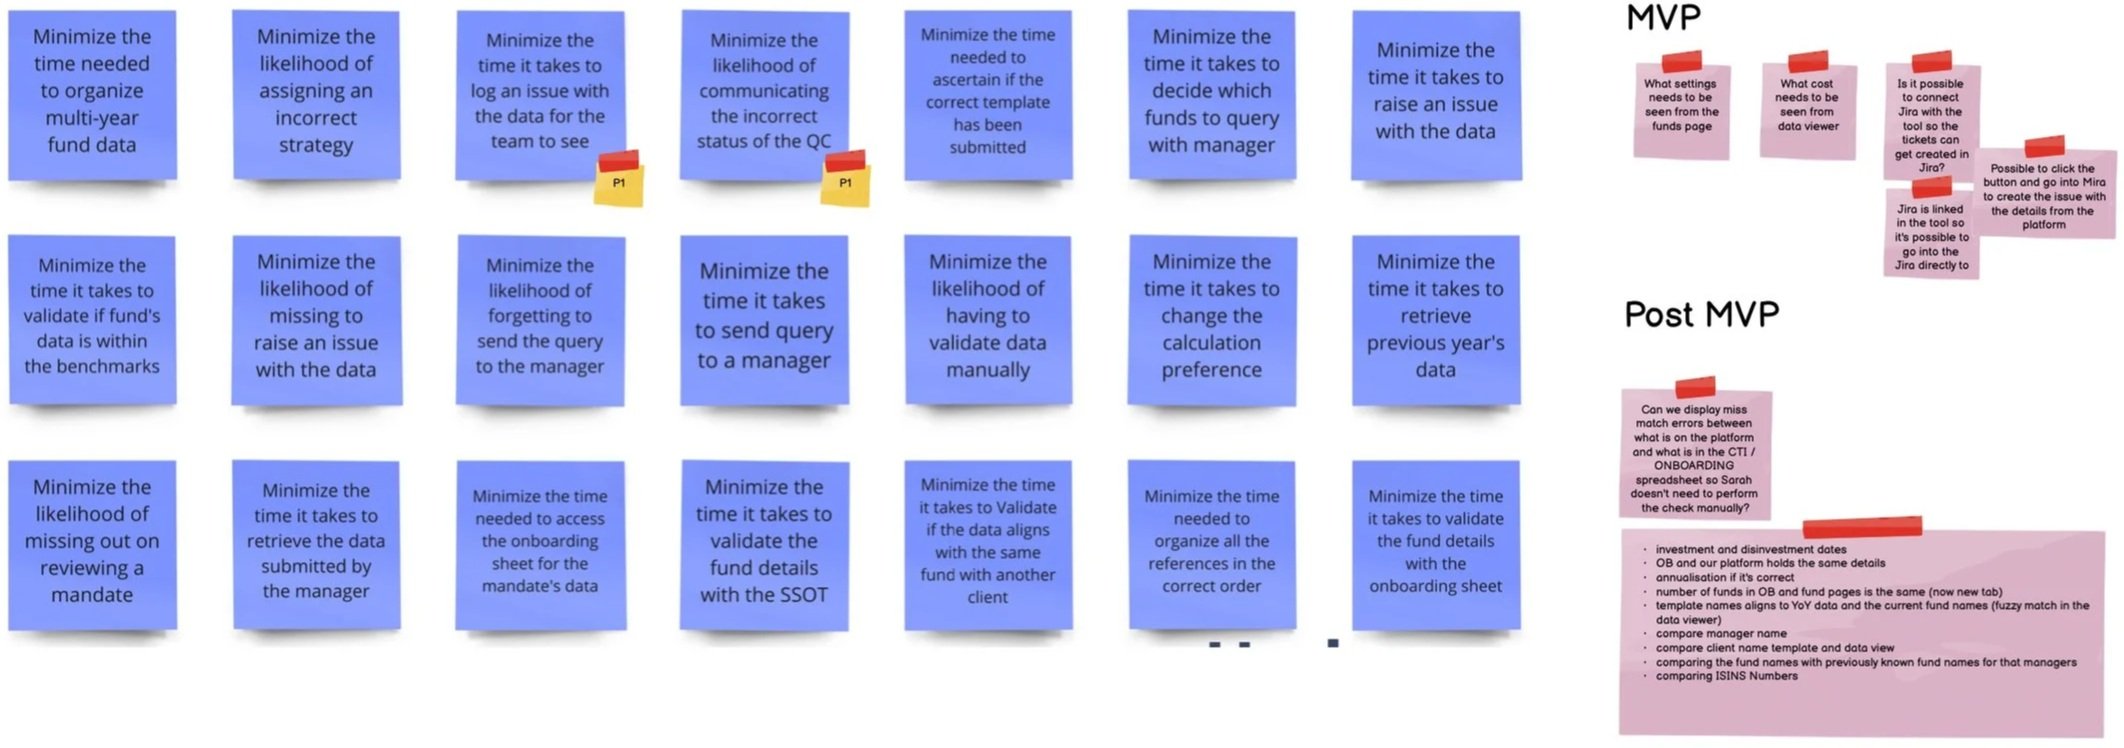
JTBD framework for framing the outcomes
Detailed flow charts to make sure all the aspects of the work and all tasks are covered
Collaborative workshops to gather domain insights
Design Sprint to build the MVP quickly
This phase helped uncover the most critical friction points in the current process. .
Key insights to focus on
Validation tasks were spread across too many tools.
Users needed clear visibility of submission progress.
Repetitive manual checks slowed down the workflow.
The process became particularly difficult during peak reporting periods.
Design Sprint for the 1st phase of product build
We assembled a multidisciplinary group that included product, design, engineering, and members of the internal data team — the primary users of the future tool.
During the Empathise phase, we focused on building a deep understanding of the internal workflow, user motivations, and operational constraints. To structure this discovery process, we developed proto-personas, and a journey map that captured the current validation process and highlighted key pain points. We dived into details using the Job To Be Done framework.
In a series of focused collaborative sessions, participants contributed insights, ideas, and operational knowledge in short time-boxed discussions. These inputs were documented and synthesised on a shared visual workspace, allowing the team to maintain alignment throughout the sprint. We did all crazy8’ sketches and then we let the team members to
Moving into the Define phase, we translated the research insights into clearly articulated problem statements and success criteria. The previously unstructured operational knowledge was organised into structured process maps that helped clarify opportunities for improvement and informed the design direction.
During the Ideation phase, participants generated solution concepts and sketched potential approaches for the tool. These ideas were then consolidated into a step-by-step storyboard, outlining the intended user journey and defining the key interactions required to support the validation workflow.
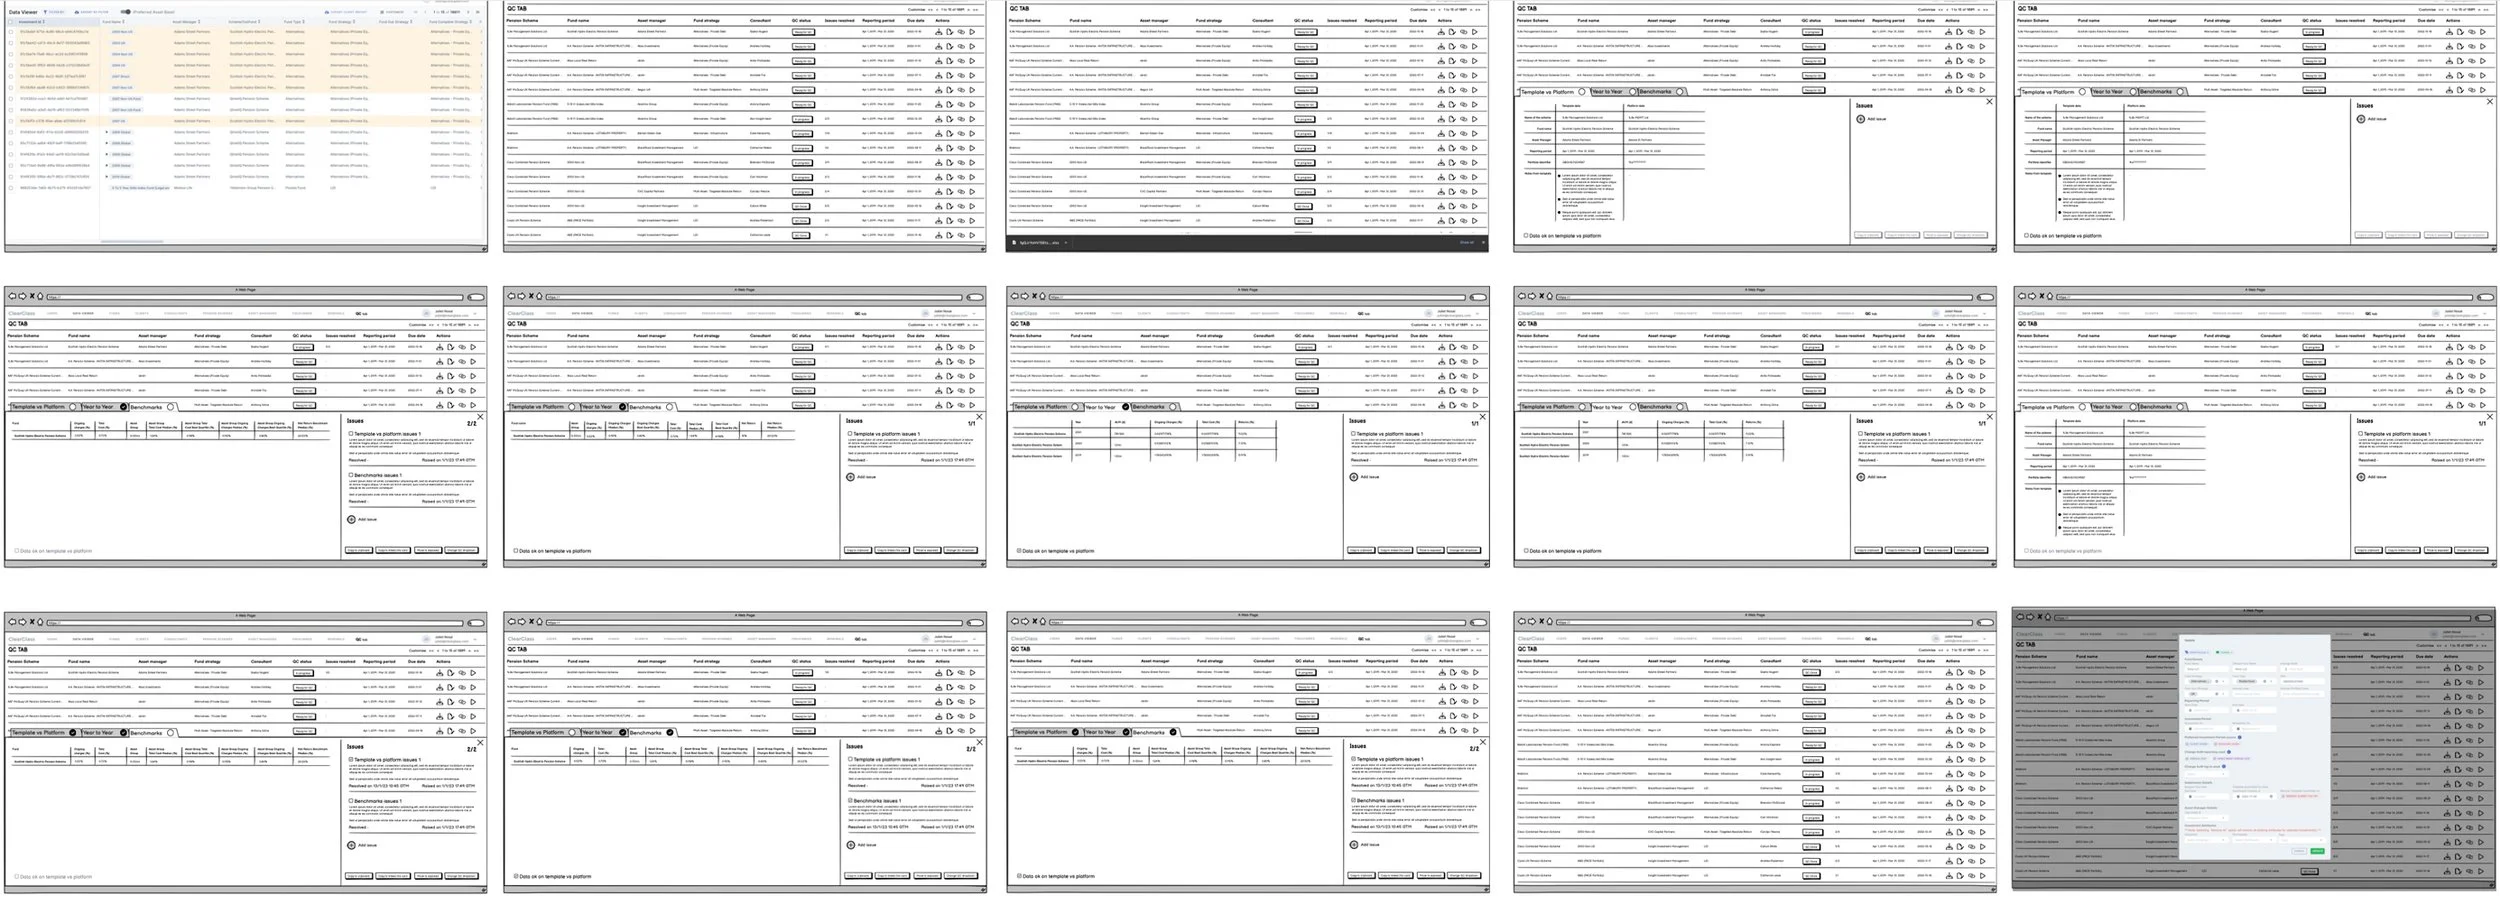
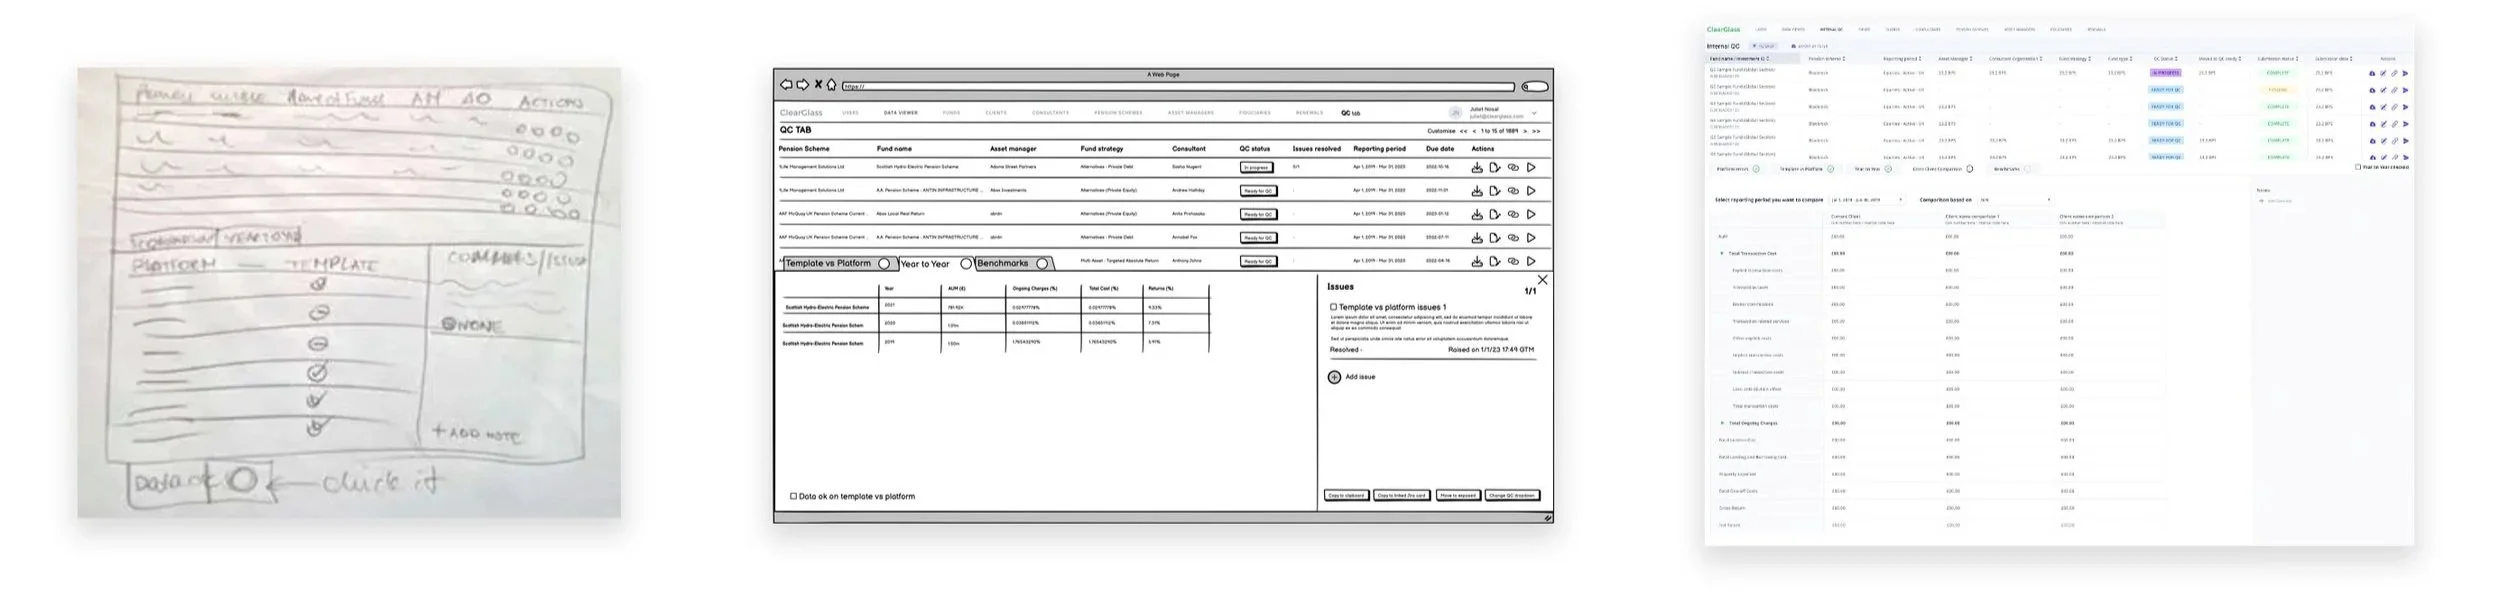
In the Design phase, I translated the storyboard into interactive wireframes and a clickable prototype, enabling stakeholders and users to experience the proposed workflow in a realistic scenario.

Testing & Iteration
The prototype was tested with members of the internal data team, who evaluated the tool within the context of their real operational tasks. Due to the complexity of the workflow and the critical nature of the data validation process, several rounds of iteration were required before the concept reached sufficient maturity to proceed to development. I created fully clickable prototype with lo-fi wireframes, which worked fully like real product experience.
Because of the complex nature of the validation process, several iterations were required to refine:
data visibility
validation interactions
workflow clarity
clear cooperation process between team members
This iterative testing allowed us to address usability issues before development.The testing rounds were very precise and quick. We followed one after another until the team and business were happy from the first product iteration.
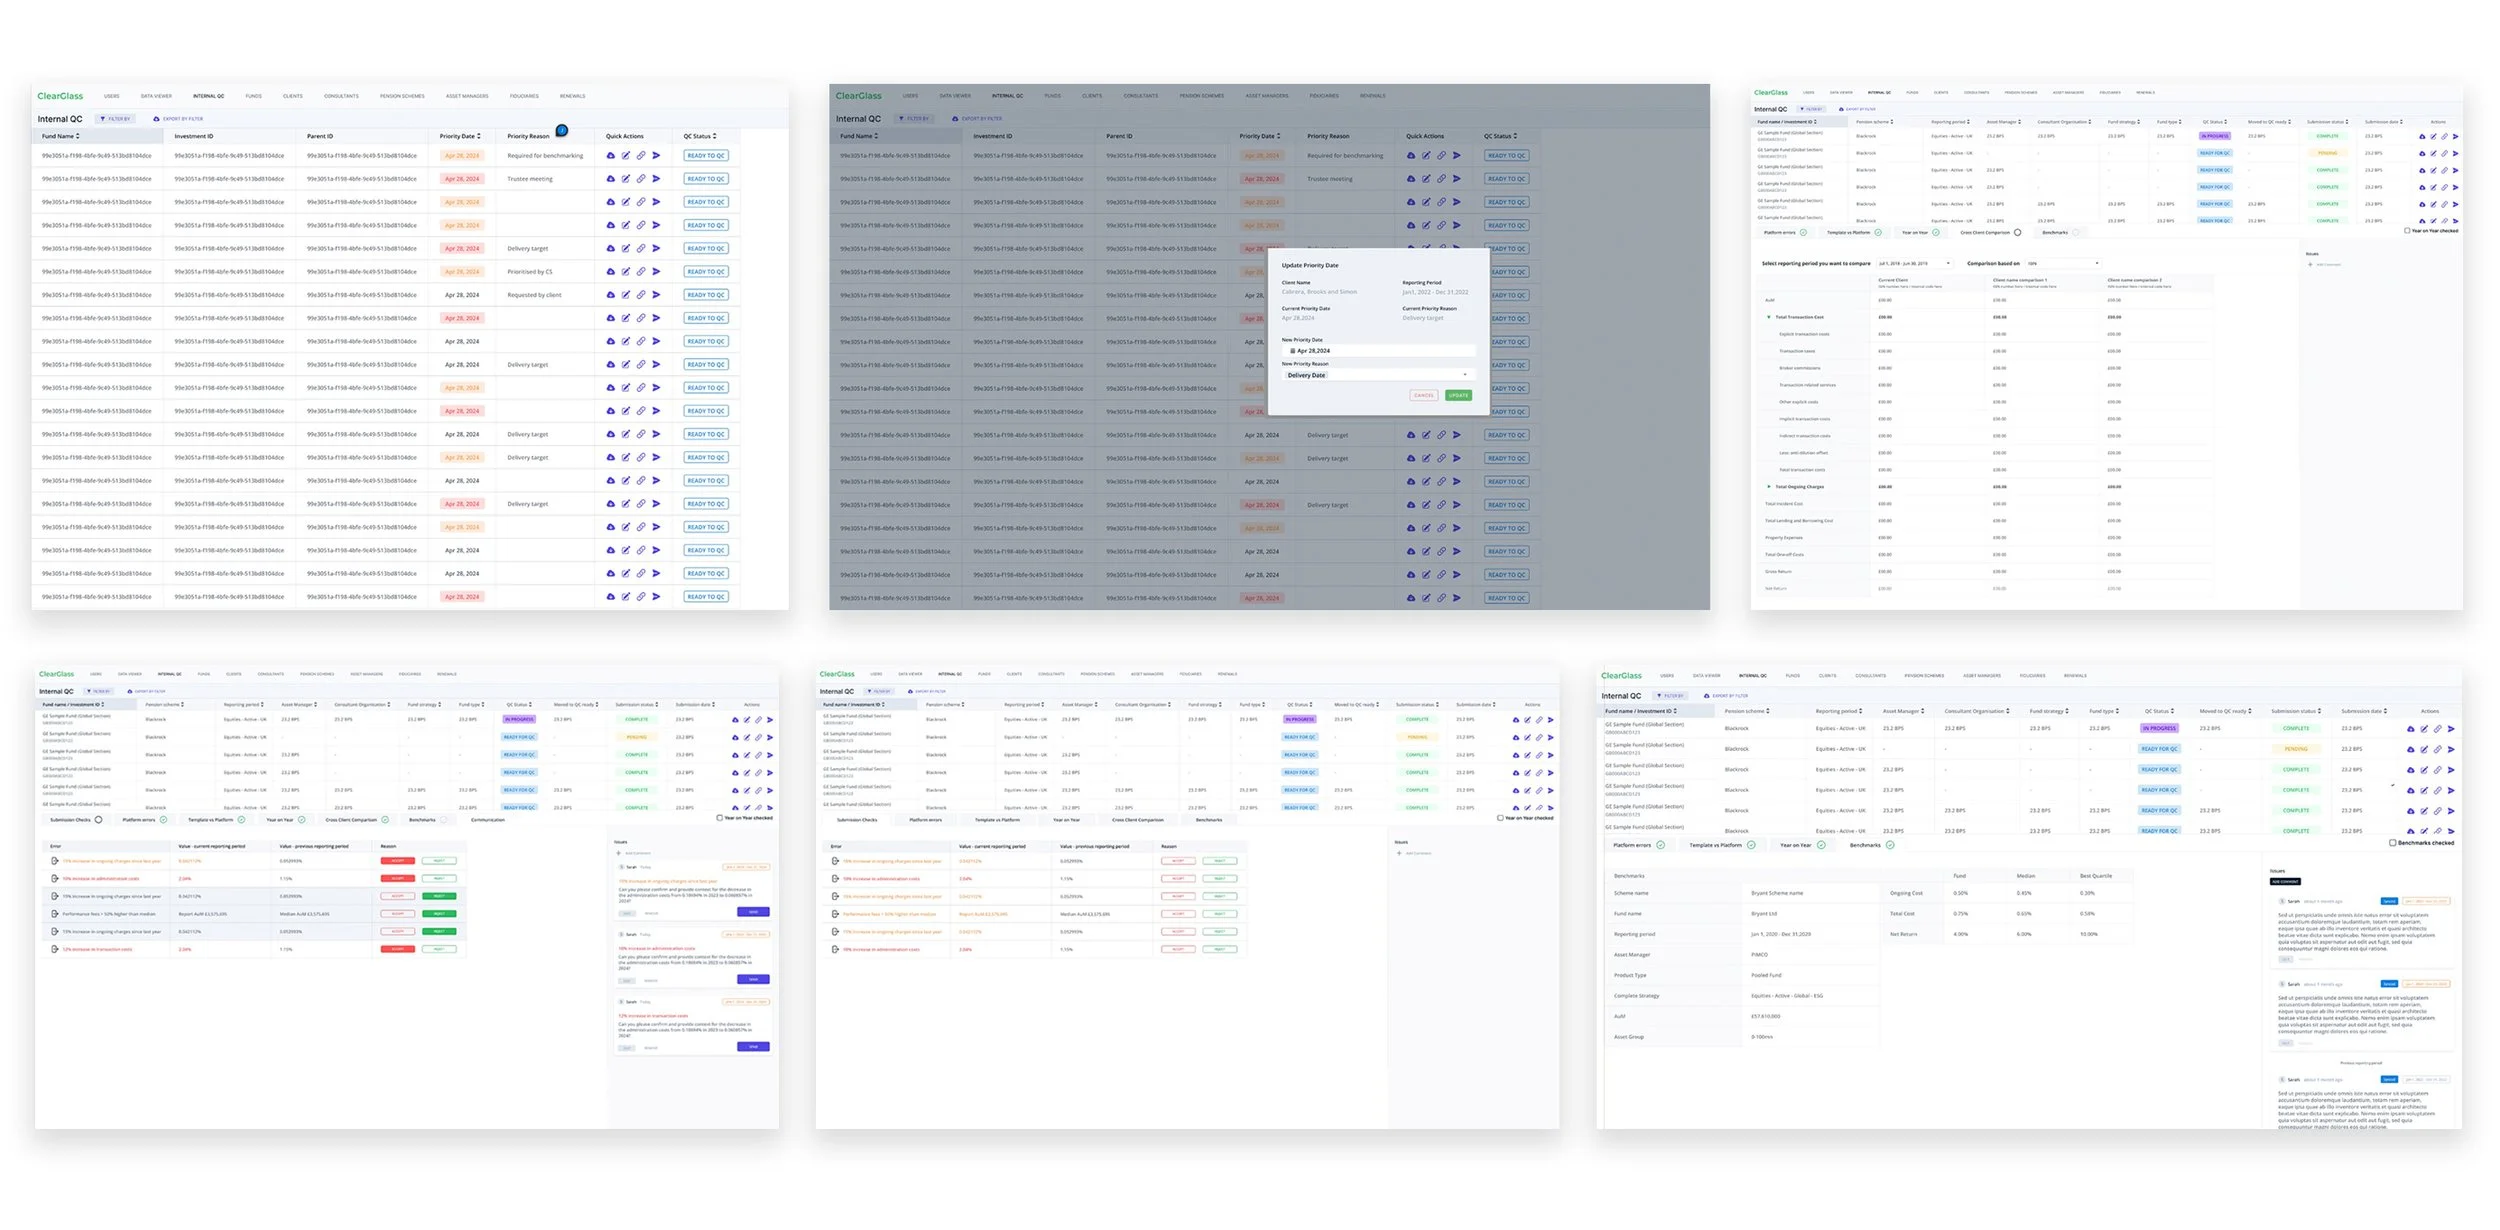
MVP Launch
Once validated, the feature was developed and released as an MVP within the internal platform.
The MVP focused on enabling the team to:
review submissions within one environment
track validation progress by using different statuses for the process
reduce reliance on external tools
pick up the work after other team members
communicate with watch other inside the tool and leave the comments
Continuous Improvement of the product in the stages
Following validation, the feature was developed and released as an MVP, allowing the team to begin using the tool in a live environment. Post-launch, we continued iterating on the feature based on real usage patterns, operational insights, and feedback from the internal data teams.
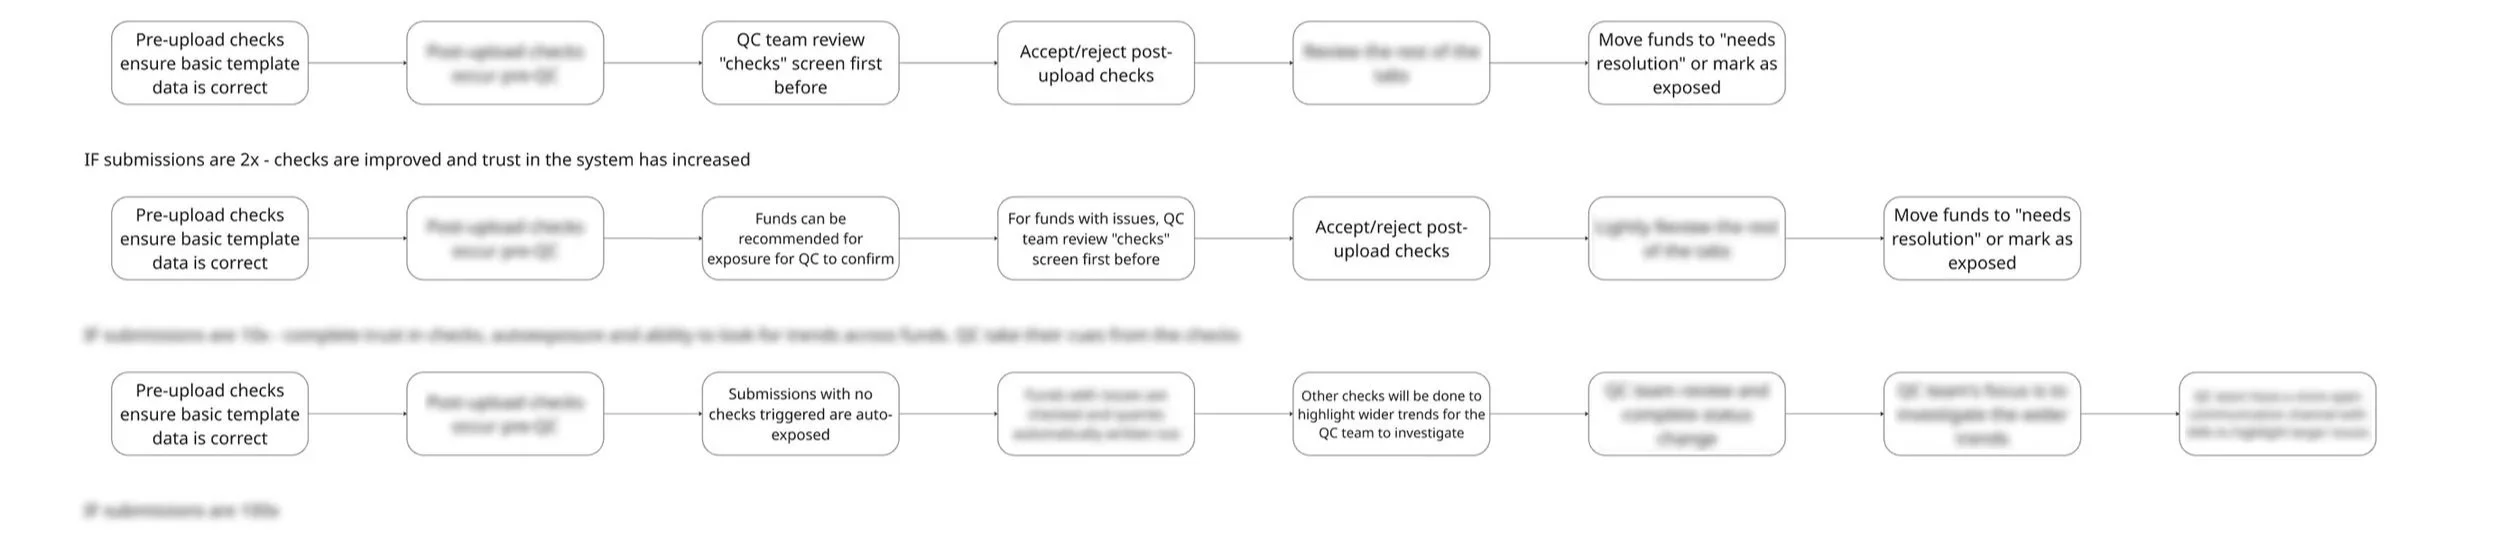
Through continuous optimisation and refinement, the tool significantly improved operational efficiency. By the following annual reporting cycle, the redesigned workflow had accelerated the data validation process by 50%, enabling the team to manage submissions more efficiently while maintaining the high standards of accuracy expected by ClearGlass clients.
The product evolved through multiple stages and iterations throughout the reporting cycle, gradually maturing into a more comprehensive and scalable solution. Due to the seasonal nature of the industry and tight reporting windows, iterations had to be delivered at an exceptionally fast pace while balancing ongoing operational demands.
To ensure the product continued evolving in the right direction, we conducted regular user interviews every two weeks alongside ongoing feedback sessions with internal teams. This continuous discovery process allowed us to validate assumptions quickly, identify pain points, and refine the experience in line with both user needs and business priorities.

Impact
The impact of the developing the tools was tremendous. The internal validation tool delivered several key outcomes:
Reduced reliance on fragmented external tools from 3 to 1
Improved workflow visibility and transparency
Increased operational efficiency during reporting cycles by 50%
Supported ClearGlass’ commitment to accurate and reliable investment data
Building the bridge between other products
The Internal Data Validation Tool became a foundational layer for several strategic platform capabilities, including the development of the Queries Hub and the future Automation of Submissions and Validation Checks. What initially started as an operational improvement for internal teams quickly evolved into a much broader systems problem, where validation, communication, and data quality became deeply interconnected across the platform.
The complexity of the challenge stemmed from the nature of the ecosystem itself. The platform served three interconnected sides of the market - asset managers, asset owners, and internal operational teams - each with different goals, levels of expertise, and dependencies within the reporting cycle. Improvements made to internal validation processes had direct impact on external communication flows, reporting timelines, and overall client experience.
As we redesigned the validation experience for internal teams, it became increasingly clear that operational inefficiencies were not caused solely by the validation process itself, but also by fragmented communication between all parties involved. Clarifications around data issues, missing information, or incorrect submissions were often handled outside the platform through emails and disconnected workflows, creating delays, duplicated effort, and loss of context.
This led to the evolution of the Queries Hub - a centralised communication layer embedded directly into the product experience. The Hub enabled internal teams, asset managers, and asset owners to collaborate within the context of the submission and validation process itself, creating a more transparent and traceable workflow across the ecosystem.
Designing the validation tool therefore required thinking far beyond a standalone internal workflow. Many of the decisions made during discovery and iteration were intentionally shaped to support future cross-product integration, automation opportunities, and scalability across the wider platform. The challenge was not only to improve operational efficiency in the present, but to establish stronger foundations for a more connected, collaborative, and scalable product ecosystem over time.